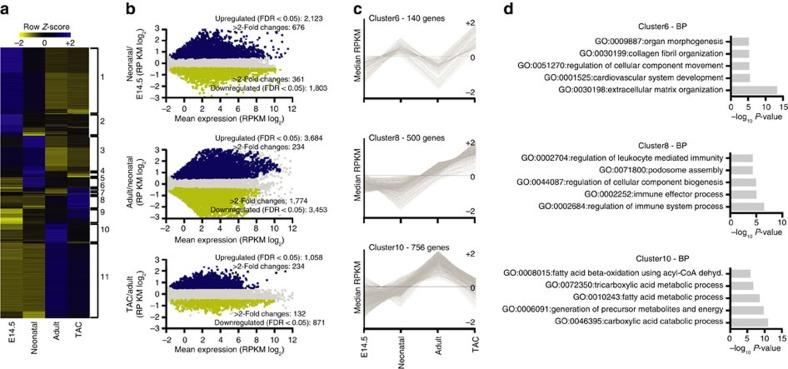
Figure 2. Transcriptional analysis during development and hypertrophy.
(a) Hierarchical clustering of the 10,302 transcripts expressed differentially among embryonic, neonatal, normal adult and hypertrophic CMCs (adjusted P-value ≤0.05, Benjamini–Hochberg correction for multiple-testing). SOTA cluster numbers are indicated to the right. (b) Comparison of gene expression in the developmental and pathological transitions by RNA-seq analysis. Shown are summary dot plots, with blue dots representing upregulated genes and yellow dots representing downregulated genes (n=2 samples each; adjusted q-value ≤0.05). (c) Examples of SOTA clustering analysis of the 10,302 differentially expressed genes. (d) Enriched GO terms of the relative SOTA cluster. GO analysis was performed with Metascape 1.0 (P-value ≤0.01).

