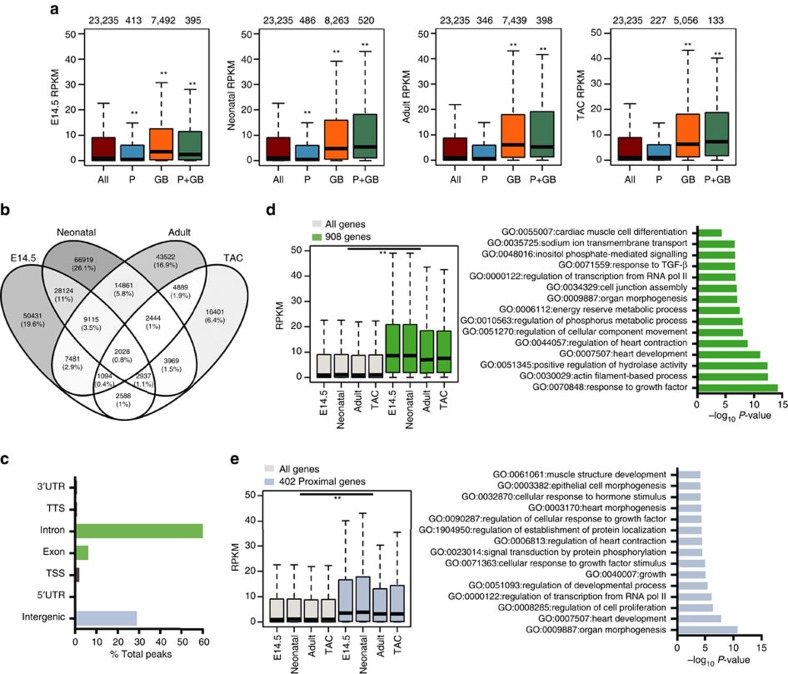
Figure 3. Correlation of 5-hydroxymethylcytosine and gene expression.
(a) Boxplots of RNA expression (RPKM) of all genes (brown bars), genes with 5-hmC exclusively present at promoters (P, blue bars), genes with 5-hmC exclusively on the GB (orange bars) and genes with 5-hmC at the promoter and on the GB (P+GB, green bars). Thick lines indicate the median, with whiskers extending to ±1.5 of the interquartile range. The number of genes in each group is shown above the plots. **P-value ≤0.01 (Mann–Whitney test). RPKM, reads per kilobase per million mapped reads. Promoters were defined as −1 kb to +1 kb relative to the TSS. (b) Venn diagram showing the number of common 5hmC-enriched intervals (peaks) across the four studied points, identified with bedtools multinter tool. (c) The presence of the 5-hmC peaks overlapping all four studied points (n=2,028) at different genomic elements. TSS, transcription start site; TTS, transcription termination site; UTR, untranslated region. (d) Boxplots of RNA expression (RPKM) of the 908 genes with at least one peak on the GB (exons plus introns) at all studied points (left). Thick lines indicate the median, with whiskers extending to ±1.5 of the interquartile range. **P-value ≤0.01 (Mann–Whitney test). RPKM, reads per kilobase per million mapped reads. Enriched GO terms relative to the 908 genes (right). GO analysis was assessed with Metascape 1.0 (P-value ≤0.01). (e) Boxplots of RNA expression (RPKM) of the 402 genes with at least one peak overlapping all the studied points proximal to the TSS (intergenic) (left). Thick lines indicate the median, with whiskers extending to ±1.5 of the interquartile range. **P-value ≤0.01 (Mann–Whitney test). RPKM, reads per kilobase per million mapped reads. Enriched GO terms relative to the 402 genes (right). GO analysis was assessed with Metascape 1.0 (P-value ≤0.01).

