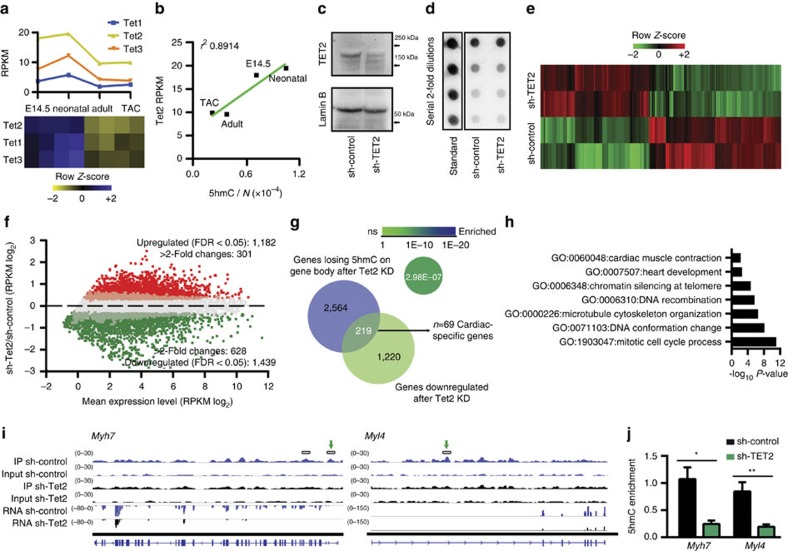
Figure 6. Involvement of TET2 in cardiac hydroxymethylcytosine deposition.
(a) Transcript abundance during cardiac maturation and hypertrophy for the three TET family genes, assessed by RNA-seq. (b) Plot showing the positive correlation between the absolute content of 5-hmC (5-hmC/N), assessed by liquid chromatography–mass spectrometry and Tet2 RNA expression (RPKM). (c) Expression of TET2 protein in CMCs expressing sh-Tet2 or sh-control. Embryonic CMCs were transduced with a lentiviral vector expressing a previously validated sh-Tet2 or a scrambled sequence (sh-control) and harvest 72 h after transduction. Lamin B was used to assess loading. Representative blot shown. Full-length blot is presented in Supplementary Fig. 10. (d) Dot blot analysis of genomic 5-hmC after KD of Tet2. (e) Heat map of hierarchical clustering of 1,182 upregulated and 1,439 downregulated genes after Tet2 RNA KD, measured by RNA-seq on two biological replicates for each condition. (f) Comparison of gene expression (RNA-seq) in CMCs expressing sh-control or sh-Tet2. Shown is a summary dot plot, with red dots representing upregulated genes and green dots representing downregulated genes (n=2 samples each; q-value ≤0.05). (g) Venn diagram showing the overlap in the number of genes undergoing 5-hmC loss exclusively on the GB (exons plus introns) and downregulation of expression (RNA-seq) after Tet2 KD. Enrichment of genes within the MGI cardiovascular expression database, calculated using Fisher's exact test. (h) Enriched GO terms relative to the 219 genes in panel (g). GO analysis was conducted with Metascape 1.0 (P-value ≤0.01). (i) IGV profiles of 5-hmC MeDIP-seq and RNA-seq profiles of representative genes (Myh7 and Myl4). DhMRs identified with MeDIPS are shown by boxes above the profiles. The scale for each track is given to the left. Exact locations of primers used to validate DhMRs are shown by green arrows. (j) Analysis of 5-hmC enrichment on Myh7 and Myl4. Data are mean±s.d. (n=3). *P-value ≤0.05; **P-value ≤0.01 (unpaired Student's t-test).

