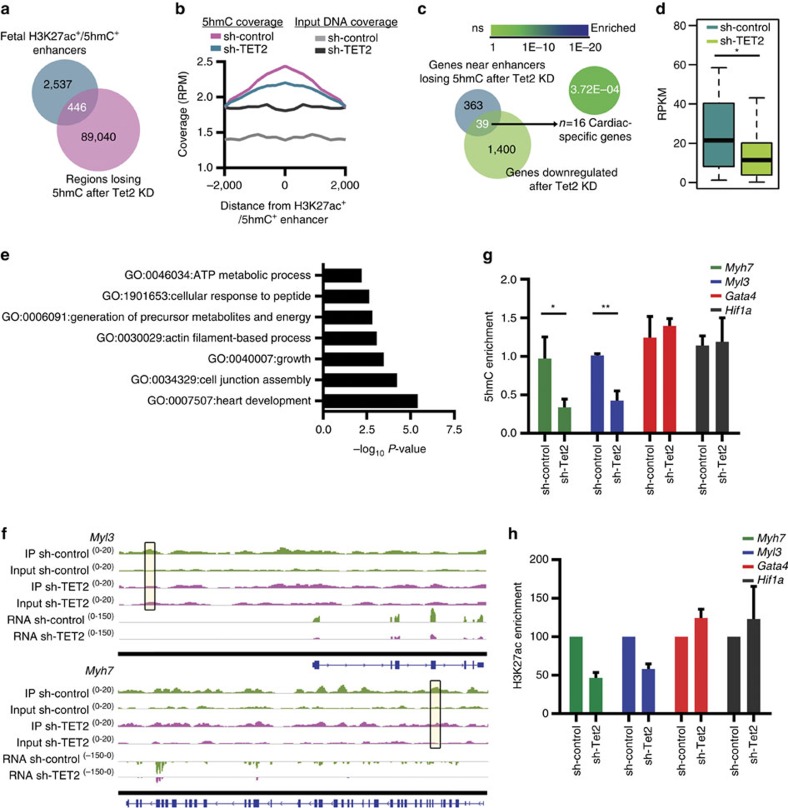
Figure 7. 5-hmC-enriched enhancers affected by KD of TET2 enzyme.
(a) Venn diagram showing the overlap in the number of H3K27ac+/5-hmC+ enhancers identified in fetal stages (E14.5 and neonatal CMC s) and the number of regions undergoing loss of 5-hmC after Tet2 KD, identified by MeDIPS. (b) Average coverage profile of 5-hmC and input DNA coverage across the H3K27ac+/5-hmC+ enhancers undergoing loss of 5-hmC after Tet2 KD. Distance from enhancer (bp) is given on the x axis. RPM, read counts per million mapped reads. (c) Venn diagram showing the overlap in the number of genes (n=402) proximal to the 446 H3K27ac+/5-hmC+ enhancers undergoing loss of 5-hmC and the number of genes downregulated (RNA-seq) after Tet2 KD. Enrichment of genes within the MGI cardiovascular expression database, calculated with Fisher's exact test. (d) RNA-seq expression values in sh-Tet2 and sh-control CMCs for the single nearest gene associated with an H3K27ac+/5-hmC+ enhancer depleted of 5-hmC after Tet2 RNA KD. Boxplots give the median (bold line), with whiskers extending to ±1.5 of the interquartile range. *P-value ≤0.01 (Mann–Whitney test). (e) Enriched GO terms relative to the 39 genes in d. GO analysis was performed with Metascape 1.0 (P-value ≤0.01). (f) IGV profile of 5-hmC MeDIP-seq and RNA-seq in sh-control and sh-Tet2 CMCs showing one intergenic (top) and one intragenic (bottom) H3K27ac+/5-hmC+ enhancer region depleted of 5-hmC (boxes) after Tet2 RNA KD, respectively, proximal to Myl3 and Myh7. Scale for each track is shown on the left. (g) qPCR analysis of 5-hmC enrichment on Myl3, Myh7, Gata4 and Hif1a H3K27ac+/5-hmC+ enhancers. Data are presented as mean±s.d. (n=3). *P-value ≤0.05; **P-value ≤0.01 (unpaired Student's t-test). (h) ChIP analysis of the enrichment of H3K27ac on Myl3, Myh7, Gata4 and Hif1a H3K27ac+/5-hmC+ enhancers. Data are presented as mean±s.d. (n=2).

