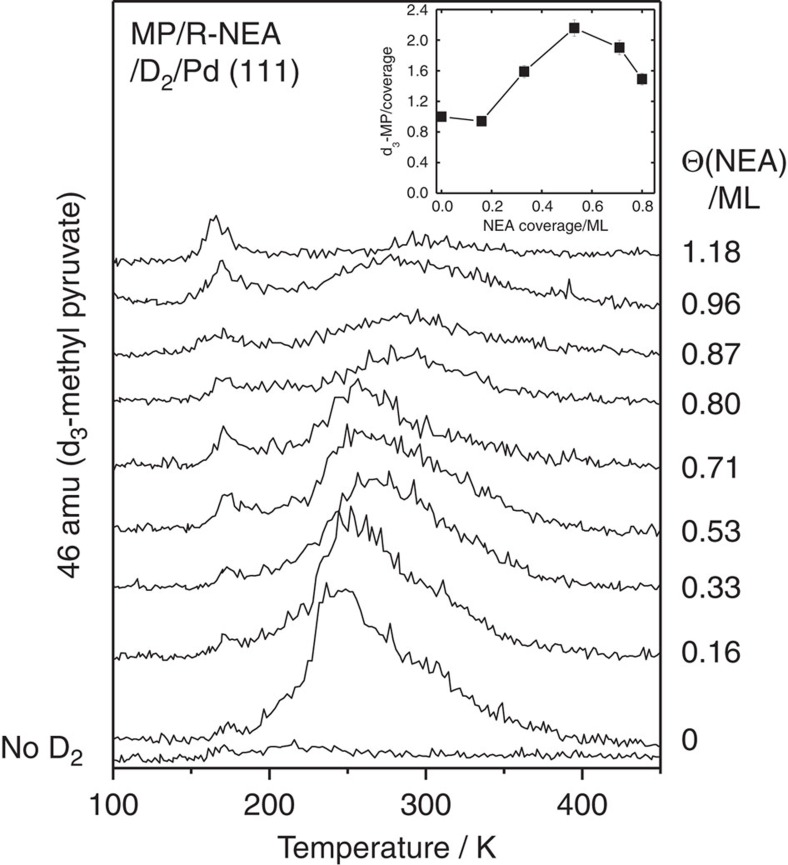
Figure 2. TPD profiles showing the effect of NEA co-adsorption on hydrogen/deuterium exchange on Pd(111).
The traces show the 46 AMU (d3-MP) TPD profiles collected following the adsorption of 3 L of MP on a Pd(111) surface precovered with NEA and saturated with hydrogen, all dosed at a sample temperature of ∼90 K, as a function of NEA coverage. The NEA coverages are measured by CO site blocking and the values are displayed adjacent to the corresponding desorption profile.

