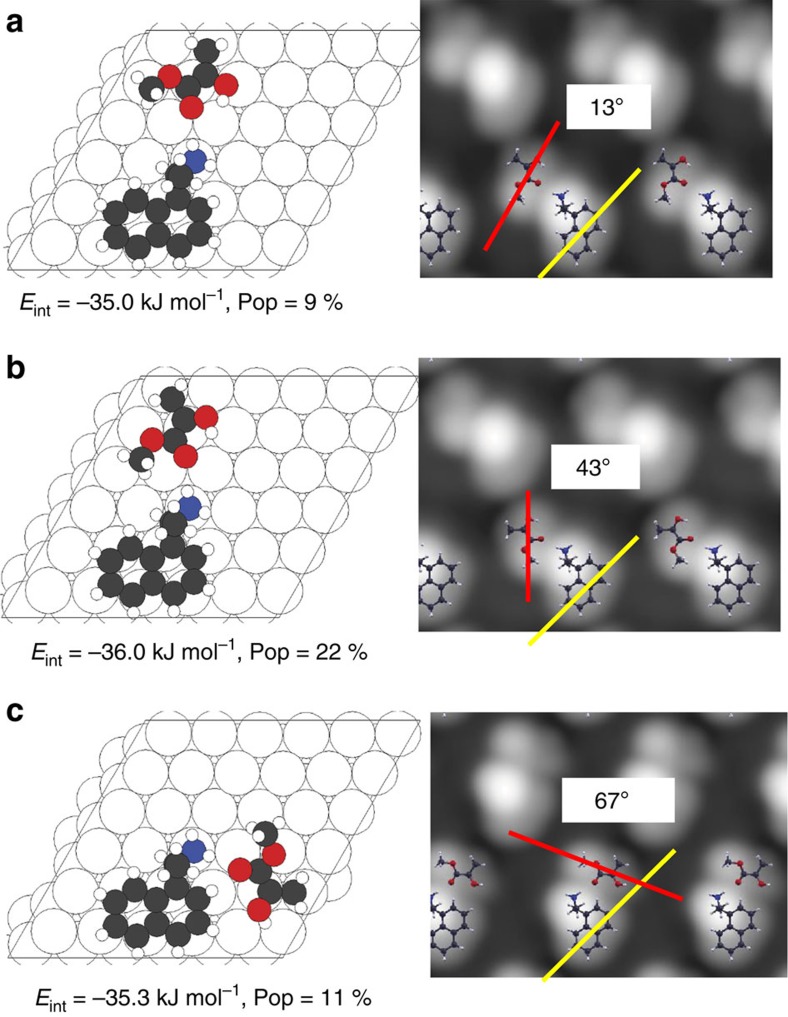
Figure 5. Calculated structures of the docking complexes that form between exo-NEA and MP on Pd(111).
Depictions of DFT-optimized structures of the most stable docking complexes formed between MP and exo-NEA adsorbed on the dibridge[6] site, indicated as a–c. The interaction energies calculated including van der Waals' interactions are shown below each structure. The STM images simulated by the Tersoff–Hamman method are shown adjacent to each structure. The angles between the axis in the simulated images of the enol tautomer of MP, indicated by red lines, and the long axis of the naphthyl group of NEA, indicated by yellow lines, are also indicated. The relative population of each type of docking complex is calculated using a Boltzmann distribution and is reported below the respective structures.

