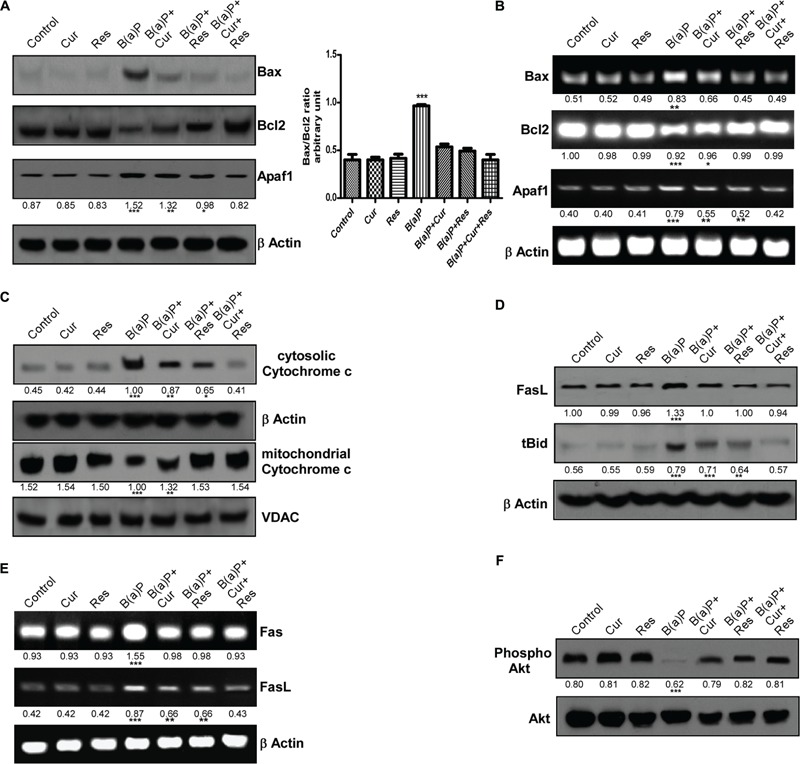
FIGURE 5.

Protective effect of curcumin and resveratrol against B(a)P induced testicular germ cell apoptosis. (A) Western blot of Bax, Bcl2 and Apaf1. The corresponding histogram (right panel) showing Bax/Bcl2 ratio, expressing mean ± SEM of relative arbitrary units of the bands for three immunoblots were conducted with separate experiments in each group. One-way ANOVA was followed by Dunnett multiple comparison test. The level of significance was set at (∗∗∗P < 0.001); (∗∗P ≤ 0.01–0.001); (∗P ≤ 0.01–0.05) in comparison with the control. β Actin was used as the internal loading control. (B) RT-PCR analysis of Bax, Bcl2 and Apaf1 in different study groups. β Actin was used as the internal loading control. (C) Western blot of cytochrome c (cytosolic and mitochondrial fraction). β Actin was used as the internal loading control for whole cell and cytosolic fractions. VDAC was used as the loading control for mitochondrial fraction. (D) Western blot of FasL and tBid. β Actin was used as the internal loading control. (E) RT-PCR analysis of Fas and FasL in different study groups. β Actin was used as the internal loading control. (F) Western blot of phospho and total Akt. The numerical values indicated below the immunoblots and PCR bands are the densitometric analysis values expressing mean ± SEM of relative arbitrary units of the bands for three immunoblots, conducted with separate experiments in each group. One-way ANOVA was followed by Dunnett multiple comparison test. The level of significance was set at (∗∗∗P < 0.001); (∗∗P ≤ 0.01–0.001); (∗P ≤ 0.01–0.05) in respect with the control.
