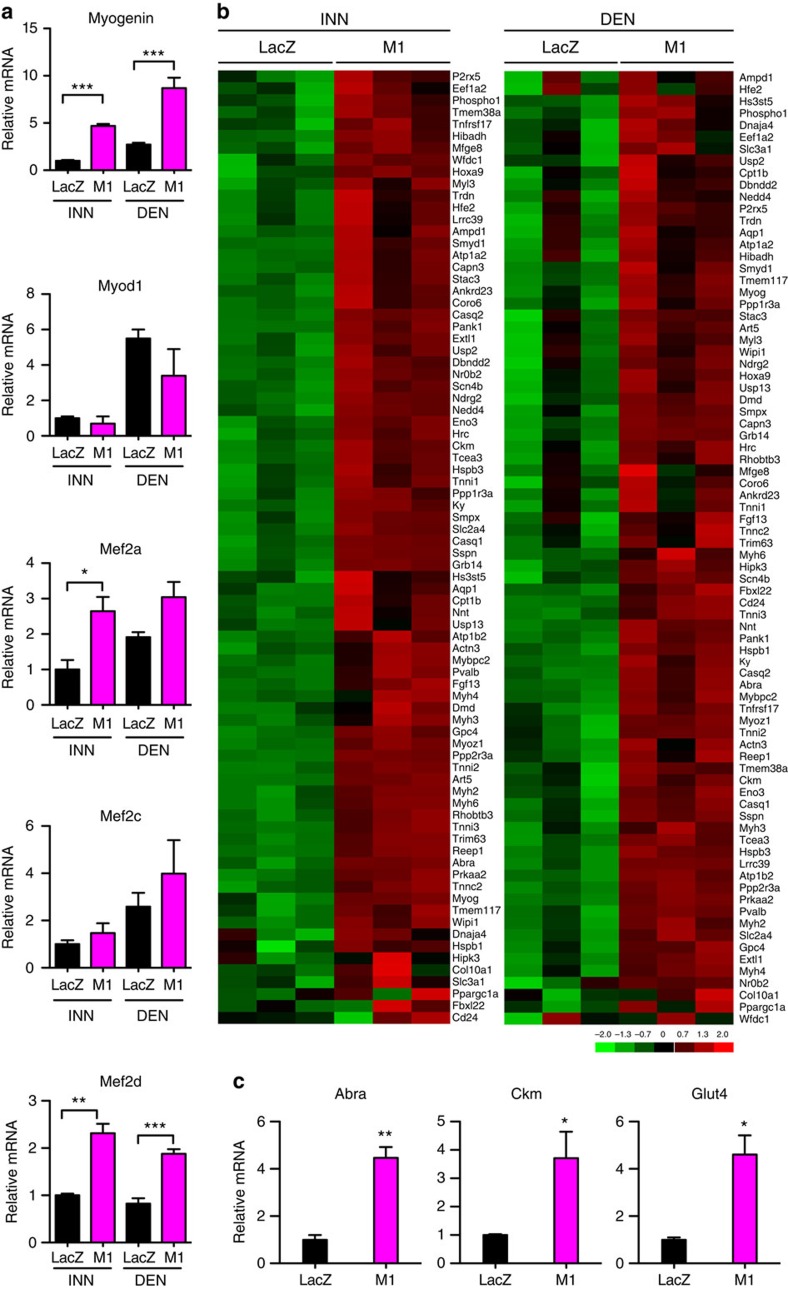
Figure 3. MEF2 targets are upregulated by Mrf4 knockdown.
(a) Changes in expression of transcripts coding for myogenin, MyoD, MEF2a, Mef2c and Mef2d induced by MRF4 knockdown, as determined by qPCR (n=3, same samples used for microarray analysis in Fig. 2). (b) Expression pattern of MEF2 target genes, as determined by crossing the results obtained from GSEA (TRANSFAC) and differential expression analysis. Red and green colours represent relative gene expression levels (red, maximum; green, minimum). (c) qPCR shows increased levels of MEF2 targets, including the genes coding for the actin-binding Rho-activating protein (Abra), also called STARS, creatine kinase (Ckm) and the glucose transporter Glut4, in muscles transfected with Mrf4 RNAi (M1) compared with control LacZ RNAi (n=3, same samples used for microarray analysis in Fig. 2). qPCR data are presented as means±s.e.m. Statistical analysis was performed using Student's two-tailed t-test (*P<0.05, **P<0.01, ***P<0.001).

