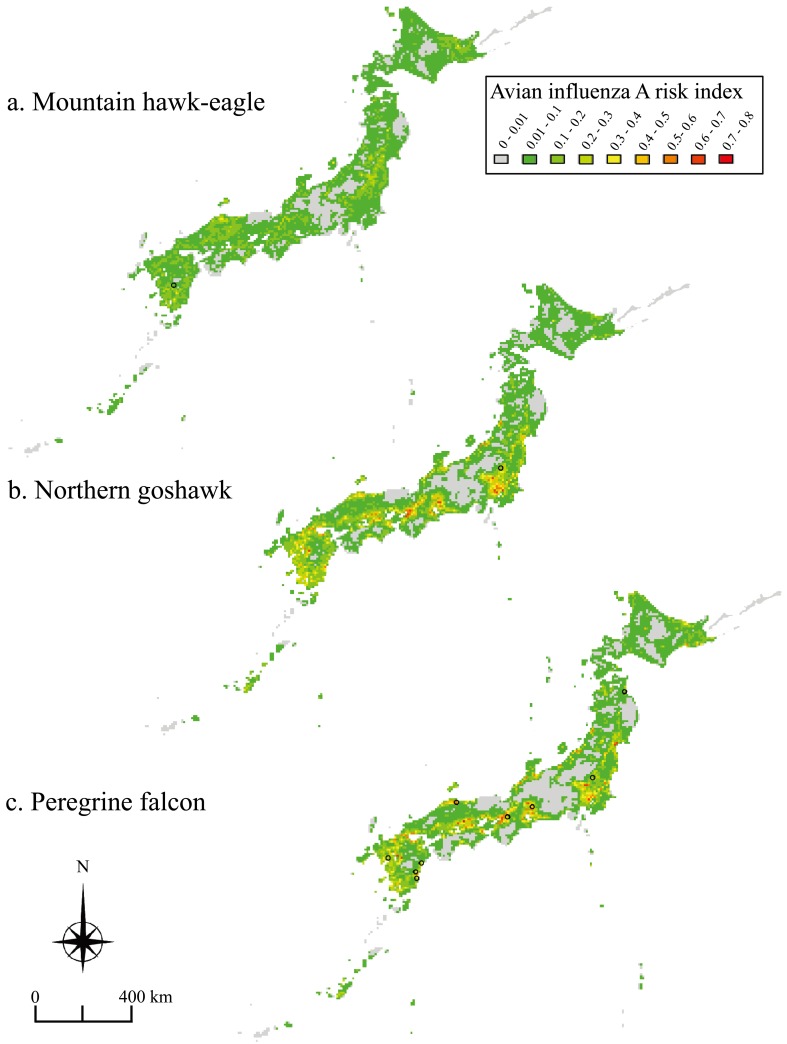
Fig. 4.
Avian influenza A risk map for the mountain hawk-eagle Nisaetus nipalensis (a), northern goshawk Accipiter gentilis (b) and peregrine falcon Falco peregrinus (c). Avian influenza A risk indices were calculated using the equation: (avian influenza A risk index) × (habitat suitability index for each raptor). Black circles indicate sites at which the carcasses of each species infected with HPAI-H5N1 were collected from 2004–2011.

