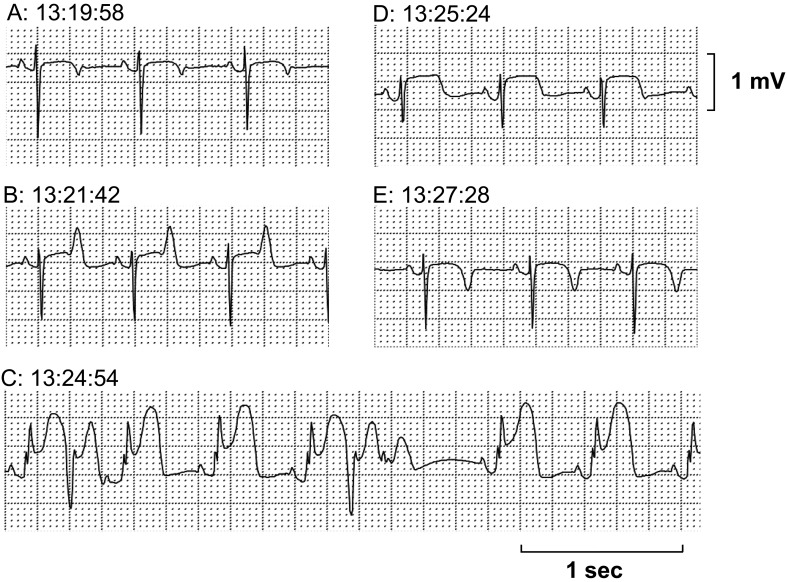
Fig. 2.
The second episode of the ST-segment elevation recorded in M-X lead by Holter electrocardiogram. (A) Control. (B) Initial phase with a tall T wave reflecting subendocardial ischemia. (C) Progressive ST-segment elevation with premature ventricular complex at peak ST-segment elevation. (D, E) Remission toward normal wave form. Total duration of the episode was about 8 min.

