Figure 4.
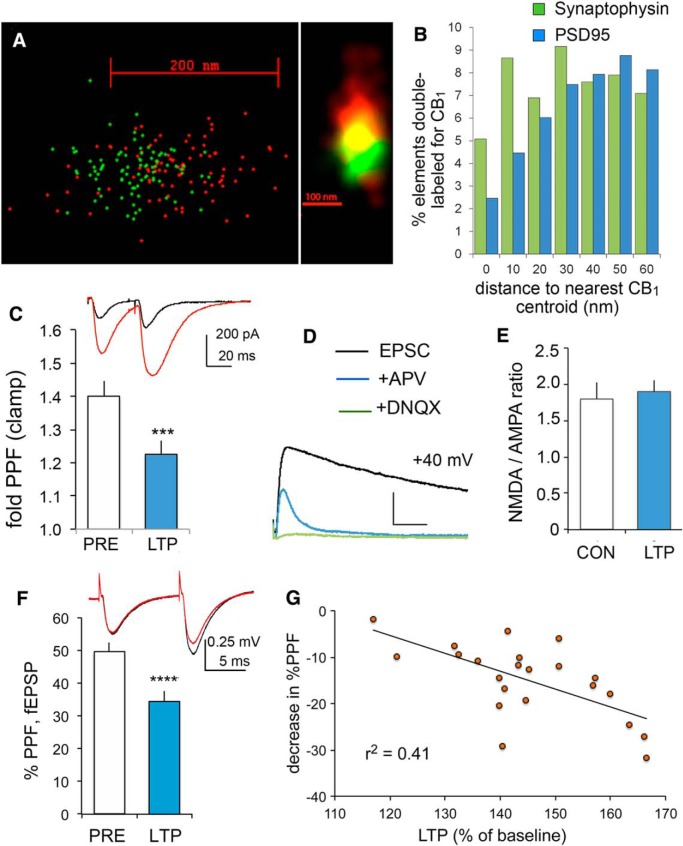
Presynaptic localization of CB1 receptors and expression of LPP-LTP. A, Illustration of STORM images showing the overlapping distribution of CB1 (red) and synaptophysin (SYN; green) immunoreactivity in a terminal within the DG outer molecular layer when visualized as nanoscale localization points (left) and density blur of the same points showing the field of codistribution in yellow (right; the blur image is rotated 90°). B, Histogram of nearest-neighbor distances between cluster centers of CB1 and either SYN+ or PSD-95+ elements. CB1+ clusters are more closely associated (<30 μm) with SYN, indicating a preferential presynaptic localization (n = 7 rats each). C, traces, Clamp recordings from a granule cell with paired-pulse stimulation of the LPP (40 ms interval between the pulses) before (black trace) and 30 min after (red trace) induction of LTP. Calibration: 200 pA, 20 ms. The graph shows that the magnitude of LPP PPF was reduced after potentiation (p = 0.0003, paired two-tailed t test, n = 10). D, To assess NMDAR and AMPAR currents, EPSCs were measured with the membrane potential held at +40 mV before (black line) and after (blue line) the infusion of APV; DNQX was infused at the end of the recording session (green line). Calibration: 200 pA, 20 ms. E, LTP did not decrease the NMDAR/AMPAR current ratio [p > 0.75; control (CON), n = 6; LTP, n = 7]. F, traces, Field recordings show LPP fEPSPs with paired-pulse stimulation of the LPP (40 ms between the pulses) before (black trace) and 30 min after (red trace) the induction of LTP. Bar graph shows that PPF of the fEPSP slope was reduced 30 min after inducing LPP-LTP relative to PPF during the pre-LTP baseline period (****p < 0.00001, n = 22;). G, In LPP field recordings, the change in PPF after the induction of LTP correlated with the magnitude of LTP.

