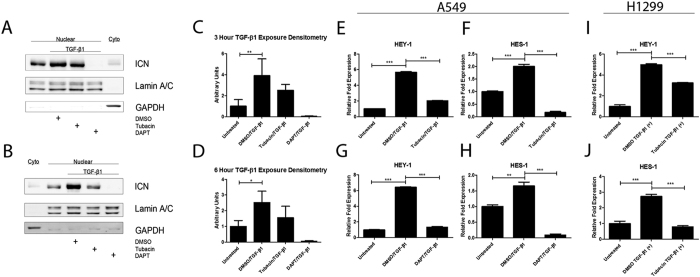
Figure 4. Pharmacological inhibition of HDAC6 abrogates TGF-β1-activation of Notch Signaling in A549 and H1299 cells.
(A) Serum-starved A549 cells were pre-treated with either 8 μM tubacin, 10 μM DAPT, or an equivalent volume of DMSO for six hours before being exposed to TGF-β1 (2.5 ng/ml) for three hours. Cell lysates were fractionated to cytoplasmic and nuclear extracts and protein levels of nuclear ICN and were examined by western analysis. (B) Same experimental design as panel (A) except the duration of TGF-β1 exposure was for 6 hours. (C,D) Densitometry analysis of western blots from three independent experiments represented in panels (A,B), respectively; levels of nuclear cleaved Notch1 (ICN) were relativized to lamin A/C. (E,F) Serum-starved A549 cells were pre-treated with 8 μM tubacin for six hours before being exposed to TGF-β1 (2.5 ng/ml) for 24 hours. RNA was isolated and quantitative RT-PCR was carried out for HEY-1 (E) and HES-1 (F). (G,H) Serum-starved A549 cells were pre-treated with 10 μM DAPT for six hours before being exposed to TGF-β1 (2.5 ng/ml) for 24 hours. RNA was isolated and quantitative RT-PCR was carried out for HEY-1 (G) and HES-1 (H). (I,J) Serum-starved H1299 cells were pre-treated with 8 μM tubacin for six hours before being exposed to TGF-β1 (10 ng/ml) for 24 hours. RNA was isolated and quantitative RT-PCR was carried out for HEY-1 (I) and HES-1 (J). The –fold change of each transcript was obtained by setting the value of the untreated cells to 1. Data for qPCR analysis presented as mean +/− SEM of triplicate wells and are representative of three independent experiments; data for densitometry analysis presented as mean +/− STD and are representative of three separate experiments statistically analyzed using one-way ANOVA. *P < 0.05, **P < 0.01 and ***P < 0.001 compared with the relative control.

