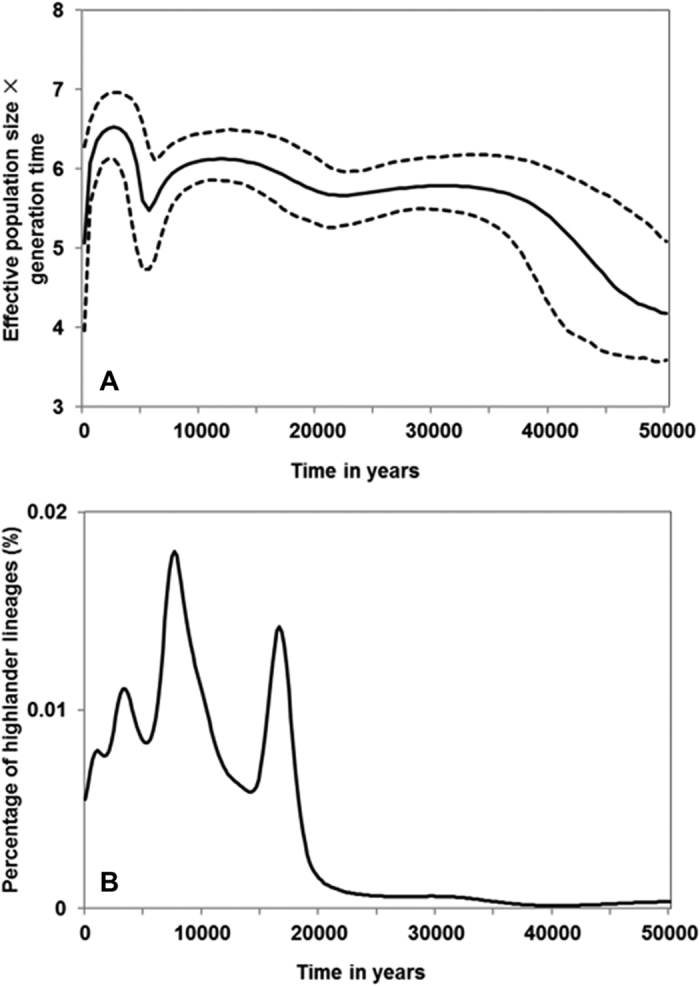
Figure 1. MtDNA Bayesian skyline plot of Tibetan highlanders and probabilistic distribution of the founding lineages.

Note: (A) The y-axis is the product of maternal effective size and generation time with a base-10 log scale. The x-axis is the time from present in units of years. The solid line is the median estimate and the dashed lines show the 95% highest posterior density limits. (B) Probabilistic distribution of founder clusters in Tibetan highlanders across time scanned at 200-year intervals from 0 to 50 kya.
