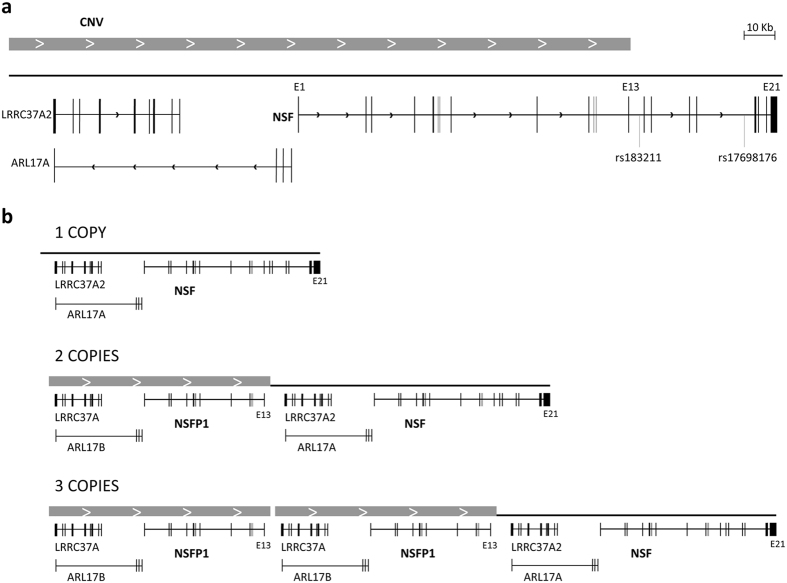
Figure 2. Schematic representation of the CNV region.
(a) Representation of genes NSF (ENSG00000073969), ARL17A (ENSG00000185829) and LRRC37A2 (ENSG00000238083). Exons are indicated with black boxes, CNV is indicated with a grey box. The location of the two SNPs previously associated with cocaine dependence is indicated. (b) Schema of genetic context of the three possible alleles of the CNV in this region: 1, 2 or 3 repeats.

