Figure 6.

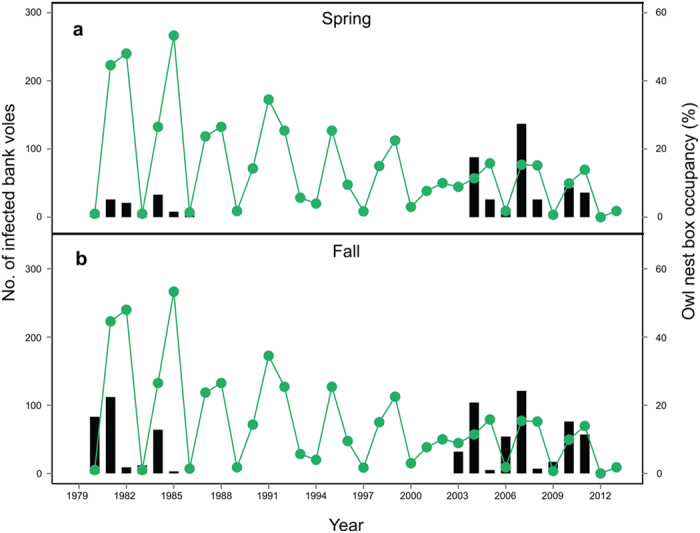
The number of infected bank voles (bars and left-hand y-axis) in (a) spring and (b) fall in two time periods: 1979–1986 and 2003–2013 and Tengmalm’s owl nest box occupancy (%) (line and right-hand y-axis) in spring in 1980–2013.

The number of infected bank voles (bars and left-hand y-axis) in (a) spring and (b) fall in two time periods: 1979–1986 and 2003–2013 and Tengmalm’s owl nest box occupancy (%) (line and right-hand y-axis) in spring in 1980–2013.