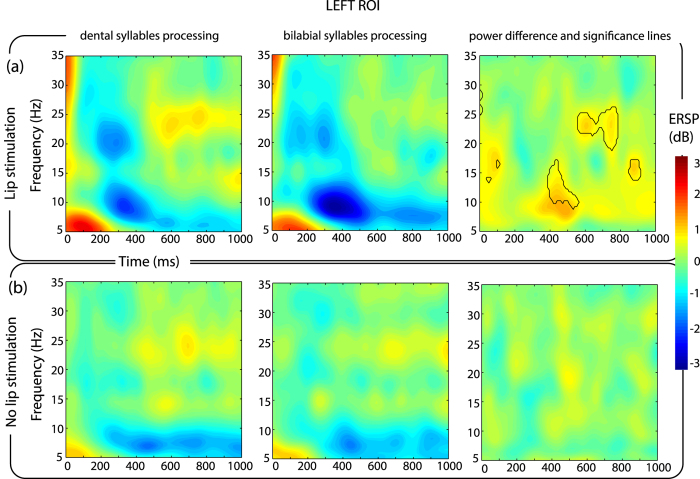
Figure 2. ERD/ERS pattern over left electrodes.
Time-Frequency maps of ERSP in the left ROI for each combination of the experimental conditions. The x axis represents time in milliseconds (Time = 0 ms corresponds to the vowel onset and when present, to electrical stimulation), the y axis represents frequency in Hz. The color represents the magnitude of the ERSP in dB. The upper row (panel a) shows the trials related to lip stimulation. The lower row (panel b) trials without lip stimulation. For each panel, the left column shows the ERSPs while listening to dental syllables (/di/), the central column for the bilabial syllables (/bi/). The third column on the right represents the difference between/di/ and /bi/. On the right column, the black-lines show the time-frequency points related to a significant difference between the processing of the two syllables (p < 0.01, FDR corrected).

