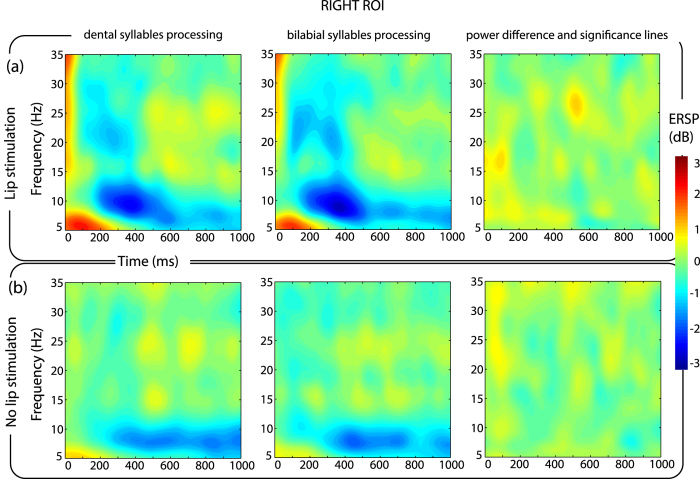
Figure 3. ERD/ERS pattern over right electrodes.
Time-Frequency maps of ERSP in the right ROI for each combination of the experimental conditions. By comparison with the left ROI (Fig. 2), it is possible to notice the absence of any significant difference related to the processing of the two sounds for both stimulation and no stimulation trials.

