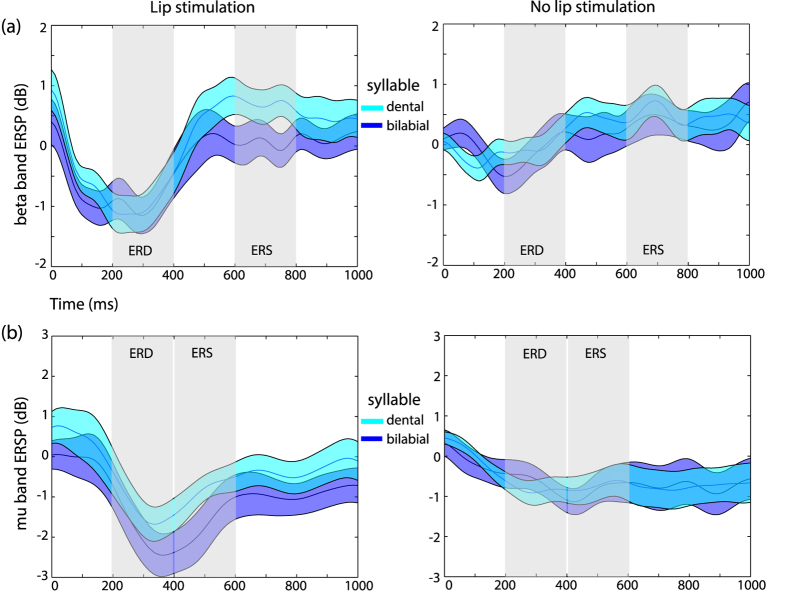
Figure 4. Beta and mu rhythms modulations by speech sounds.
Time course of ERSP in the beta (panel a) and mu (panel b). The left columns show the result for the stimulation trials, the right for no stimulation trials. Shaded areas indicate the time windows of the ERD and ERS selected for the analysis, based on the exploration of the spectrograms. ERSP related to the processing of dental syllables are depicted in cyan, whereas for the bilabial syllables the traces are in dark blue. Shading around the traces represents two standard errors from the mean.

