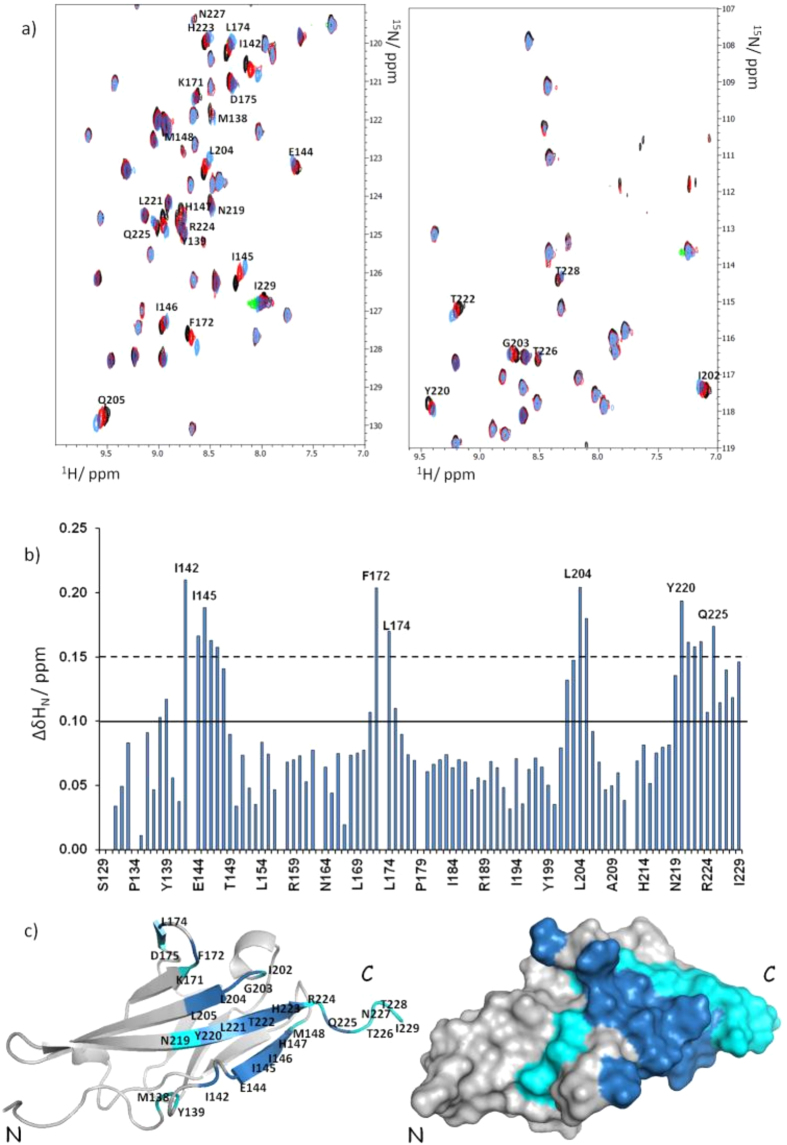
Figure 9. Chemical shift perturbation studies of VEGFR1D2 with EP6.
(a) Superposition of two 2D [1H,15N] HSQC sections of VEGFR1D2 in the absence (black), in the presence of 1 equivalent (red) or 5 equivalents of EP6 (blue). The most relevant shifts observed in the amide cross-peaks are indicated. (b) Bar graphs of the average combined chemical shift differences (∆δHNav) as a function of sequence. The mean value is shown as a continuous line (∆δHNav ≥ 0.10 ppm); the mean value plus standard deviation is shown as a broken line (∆δHNav ≥ 0.15 ppm). (c) Chemical shift mapping onto one representative model of the VEGFR1D2 NMR structure (PDB ID: 1QSV) shown as ribbon (left) and as solvent-accessible surface (right). Residues for which 0.010 < ∆δHNav < 0.015 are shown in cyana; residues for which ∆δHNav > 0.15 are shown in sky blue. Figure was prepared using the software PYMOL (The PyMOL Molecular Graphics System, Version 1.8 Schrödinger, LLC).

