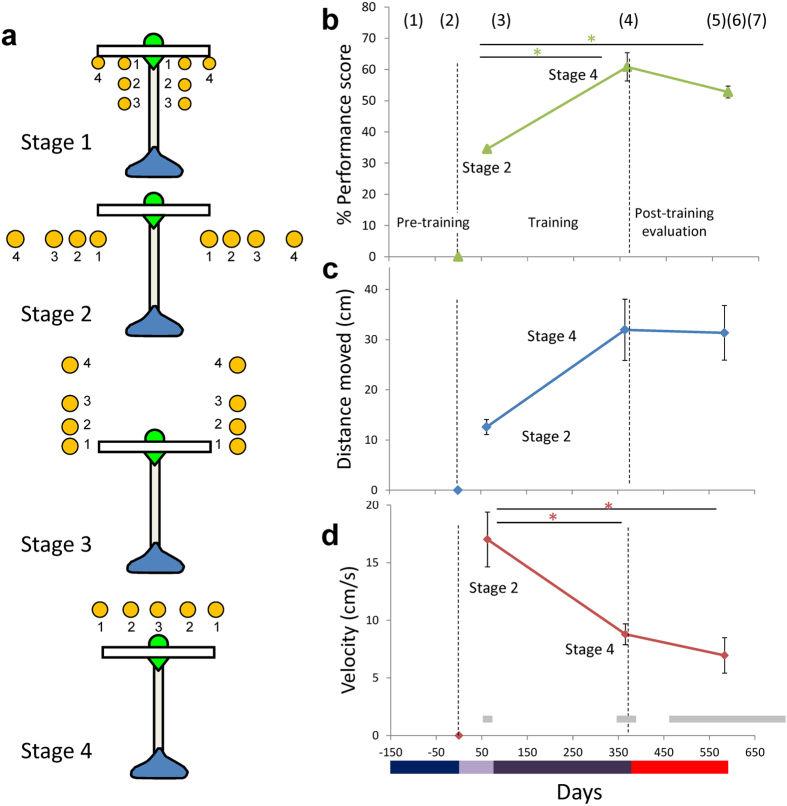
Figure 1. Task protocol and behavioral indices for tool use by common marmosets.
(a) Top view of the tool showing the head (white), the shaft (gray) and the handle (blue) in the conditions in each training stage. Position of food items is indicated by small yellow circles. The small numbers (1–4) in each Stage denote the steps within a Stage. (b–d) Behavioral indices for tool use by common marmosets, averaged for four marmosets with standard errors of means (SE), as a function of experimental phases depicted in days (see Fig. S1 for individual data). Numbers (1 to 7) in parenthesis on the top of (b) show the time points at which MRI scans were carried out. Horizontal gray bars in (d) indicated the ranges in days at which the scanning was carried out in individual subjects. A color bar on the bottom of the figures corresponds to the experimental phases of pre-learning evaluation (dark blue), Stage 1 to 2 (light purple), Stage 3 to 4 (dark purple), and post-learning evaluation (red). Significant differences found by multiple comparison analysis were depicted in *(p < 0.05). (b) % performance score. 100% means the marmosets could retrieve the food item without any help from the experimenter in all tested trials (Methods). (c) The distance moved (cm) by the rake head in each trial. (d) The mean velocity (cm/s) of the rake head during manipulation of the tool.

