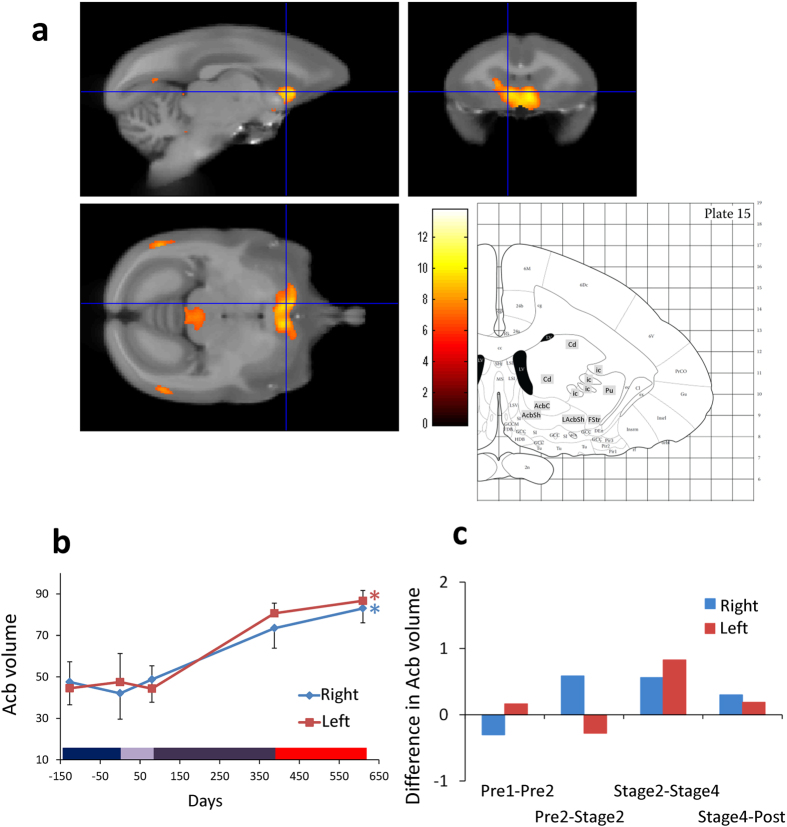
Figure 2. Gray matter increases in bilateral Acb.
(a) The color scale indicates the t score and the area of significance has been superimposed on a template brain, together with the corresponding coronal image (interaural −11.8−mm, Plate 15) of the marmoset brain atlas7. AcbC: accumbens nucleus core; AcbSh: accumbens nucleus shell; LAcbSh: accumbens nucleus shell, lateral part; Cd: caudate nucleus; FStr: fundus of striatum; ic: internal capsule; Pu: putamen. (b) Time course of bilateral gray matter volume change in peak voxels in Acb, depicted in right (blue) and left (red) hemispheres, averaged across four subjects, with SE (n = 4, *p < 0.05). Color bar on the bottom is the same as in Fig. 1. (c) Difference in bilateral Acb gray matter volume in peak voxels in both hemispheres between adjacent periods, calculated per week. Left gray matter volume increased especially later phases of the experiment.

