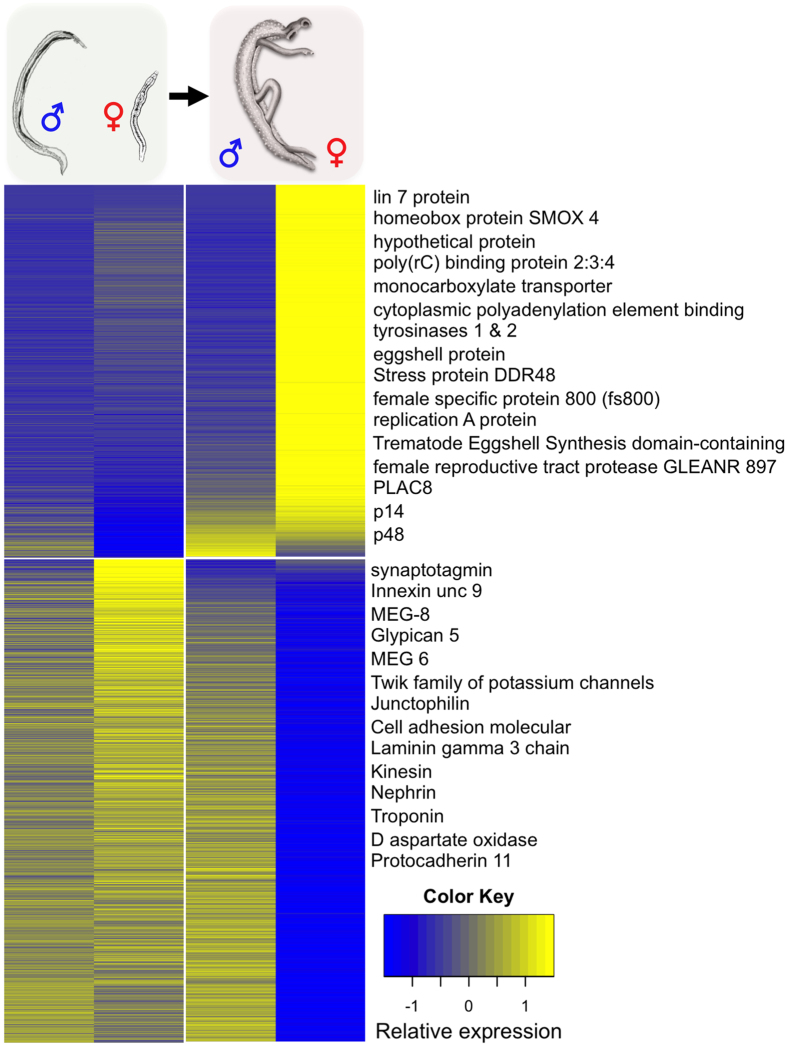
Figure 3. Heatmap presentation of the hierarchical clustering of 3,748 female DEGs based on their higher (upper panel, 1,591 genes) or lower (lower panel, 2,157 genes) transcript numbers.
Transcript abundance across all worm samples is shown as follows: sM (1. column), sF (2. column), bM (3. column), and bF (4. column). Yellow and blue colors indicate high and low abundance, respectively. Exemplary genes (comprising largest fold-changes) are indicated by name showing that e.g. egg synthesis-associated genes such as tyrosinase, p14, and p48 are transcribed at the highest levels in bF (upper panel). In contrast, transcript levels of genes associated with motor function such as kinesin or troponin, or cell adhesion such as cell adhesion molecular or protocadherin decreased in bF (lower panel).

