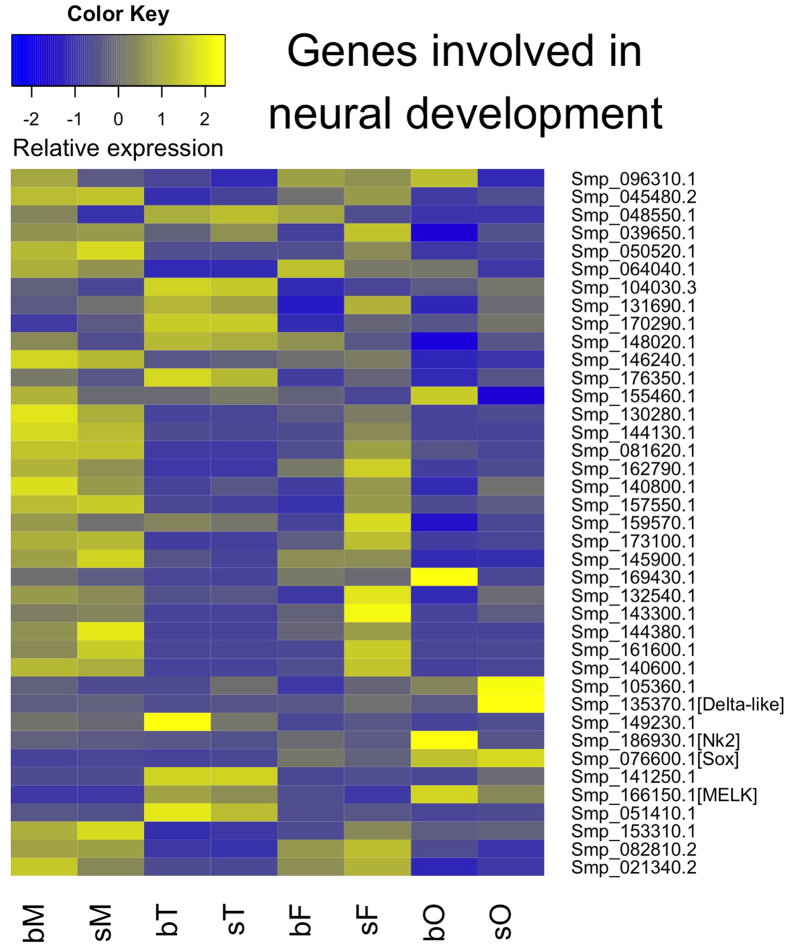
Figure 5. Hierarchical clustering of genes involved in neural processes.
Blue and yellow colors indicate low and high transcript levels, respectively (see color key). Right labeling: Smp numbers of the 61 genes, whose function has been associated with neural processes10. Exemplary genes are indicated by name according to their annotation. Bottom line: all compared samples (bM, bisex males; sM, single-sex males; bT, testes from bisex males; sT, testes from single-sex males; bF, bisex females; sF, single-sex females; bO, ovaries from bisex females; sO, ovaries from single-sex females).

