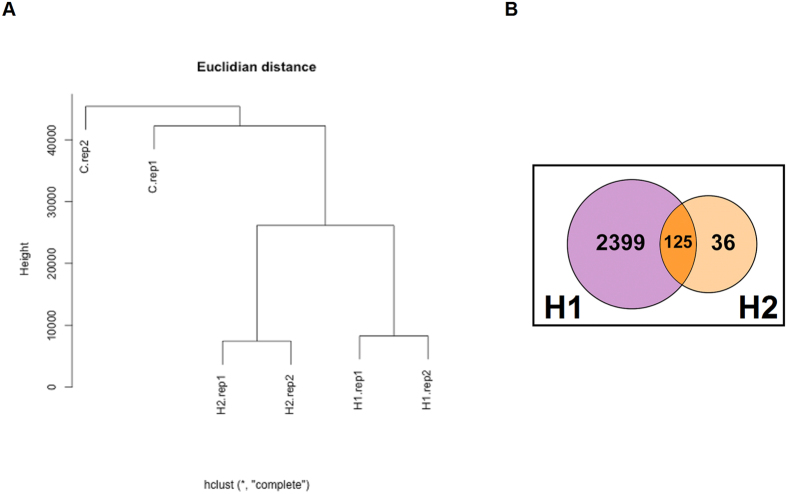
Figure 4. RNA-seq analysis of CRISPR/Cas9 edited HEK293T cells.
RNA-seq was performed on duplicate samples (two independent experiments) to determine differential transcript expression of genome edited HEK293T cells. (A) Shows hierarchical clustering with Euclidian distance (Untreated: empty vector, H1: Haplotype 1 and H2: Haplotype 2. (B) Venn diagram showing number of transcripts that are significantly different in H1 and H2 compared to wild type cells.

