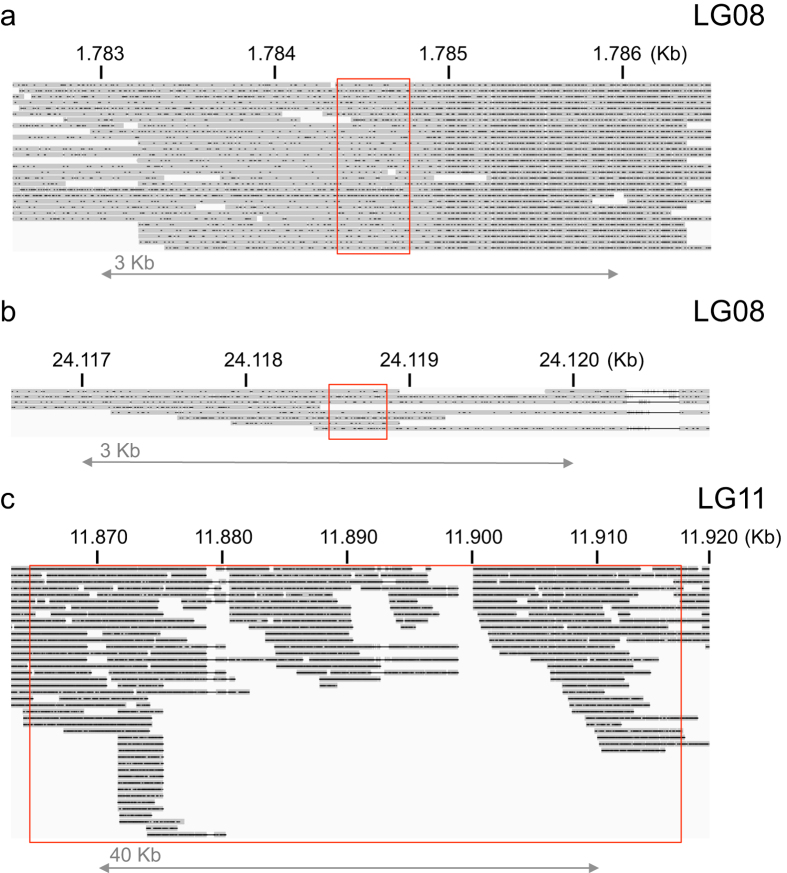
Figure 2. PacBio read alignments of a female Atlantic cod specimen.
Long read alignments (grey) towards the male gadMor2 reference genome overlap those regions containing sex-associated genotypes (red box) on LG08 (a,b) and LG11 (c). Note the different genomic scale (in Kb) for each of the sub-panels. Small indels (black dots) within the alignments are a typical feature of PacBio read data. Read alignments are visualized using the Integrative Genomics Viewer.

