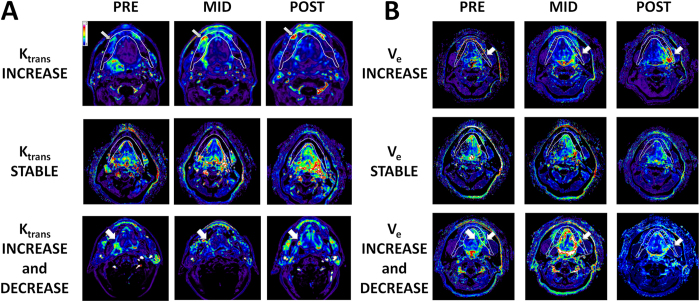
Figure 2. DCE-MRI Detects Focal Vascularity Changes During EBRT.
Evaluation of DCE-MRI acquired Ktrans across the entire mandibular volume allows for identification of geographically distinct perturbations which can then be correlated to the dosimetric map for each individual patient. (A) Arrows in top and bottom rows identify the area of altered Ktrans. Middle row demonstrates no appreciable change in Ktrans across the entire mandibular volume regardless of administered EBRT dose. (B) Arrows in top and bottom rows identify the area of altered Ve. Middle row demonstrates no appreciable change in Ve across the entire mandibular volume regardless of administered EBRT dose. Panels A and B represent distinct patients.

