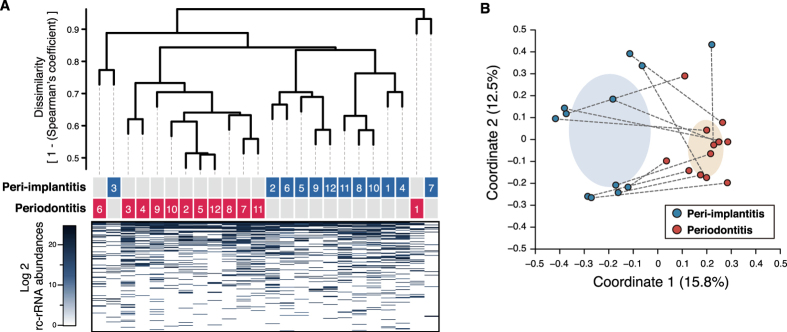
Figure 1. Dendrogram with a heat map and a PCoA plot of rc-rRNA profiles.
(A) Dissimilarity values (1 − Spearman’s coefficient) were clustered using the average linkage method, as shown in the dendrogram. Disease types and patient numbers are shown under the tree. The heat map shows log2 rc-rRNA abundances for each taxon, as indicated by the colour gradient. (B) PCoA was carried out for the dissimilarity matrix value of 1 − Spearman’s coefficient, and 12 samples from the peri-implantitis (blue circles) and periodontitis (red circles) groups were plotted with two coordinates. The mean and standard deviation in each axis are indicated by an ellipse for each disease group. Dots corresponding to peri-implantitis and periodontitis samples from the same patient are connected by a broken line.

