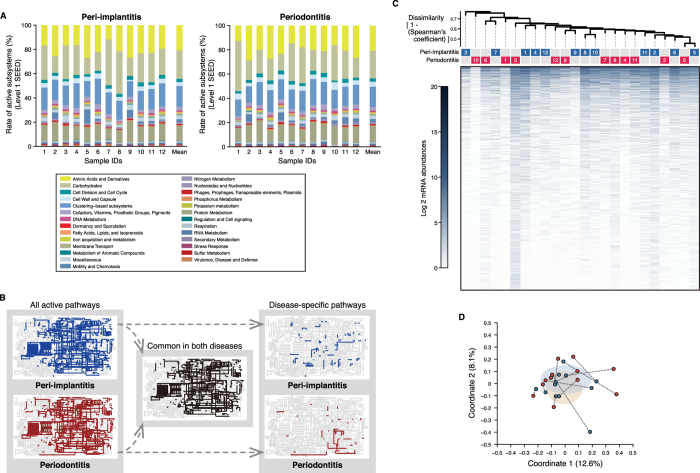
Figure 2. mRNA profiles obtained following assignment with SEED subsystems and KEGG and NCBI nr databases.
(A) Percentage composition of level-1 SEED subsystems are shown for each sample ID, with the corresponding colours shown in the box below. (B) Active KEGG pathways present in any of the 12 samples for each disease (left map) and common and disease-specific pathways (middle and right maps, respectively). (C) Dendrogram constructed based on mRNA abundances during assignments with the NCBI nr database, as described in Fig. 1A. (D) PCoA plot prepared from mRNA profiles assigned with the NCBI nr database, as described in Fig. 1B.

