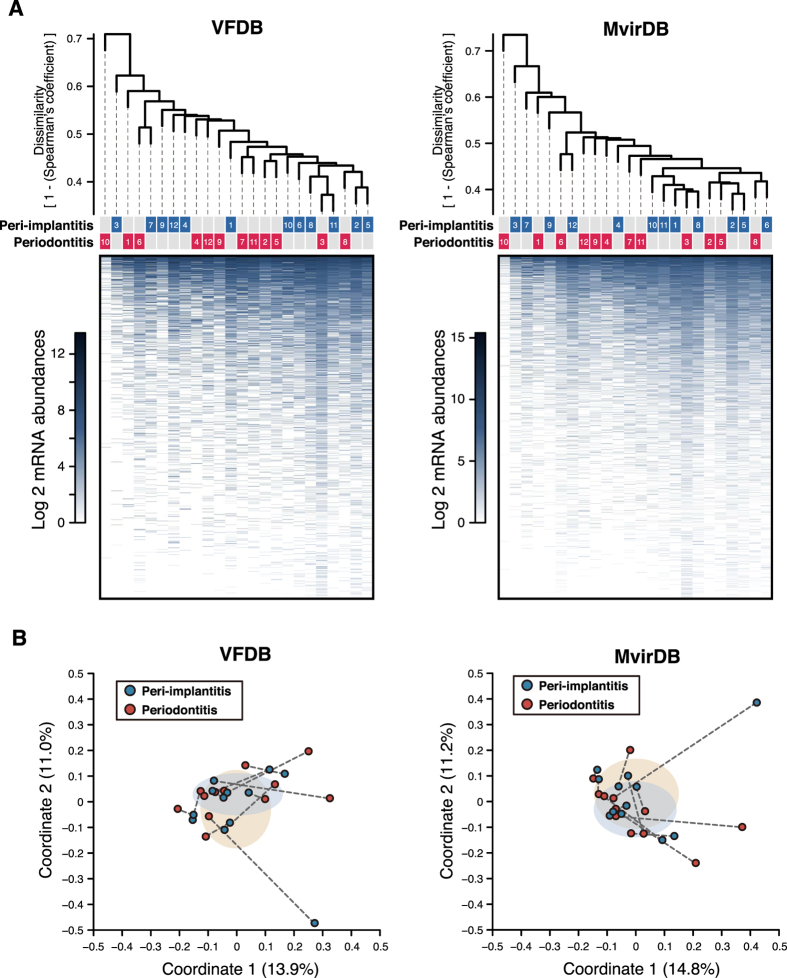
Figure 3. Functional mRNA profiles for assignments made with VFDB and MvirDB.
(A) Dendrograms constructed as described in Fig. 1A. Disease types and patient numbers are shown under the tree. The heat map shows log2 mRNA abundances for each functional gene. (B) PCoA plots prepared as described in Fig. 1B.

