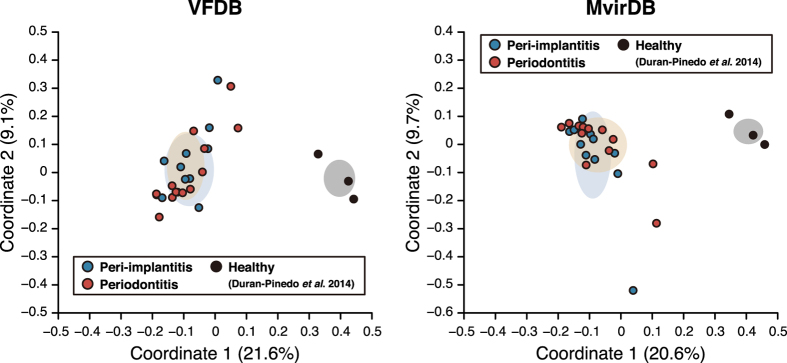
Figure 4. PCoA plots of functional profiles for diseased and healthy sites.
PCoA plots of functional profiles for our sequence data, as well as downloaded data pertaining to healthy sites assigned with the VFDB and MvirDB, were prepared as described in Fig. 1B.

