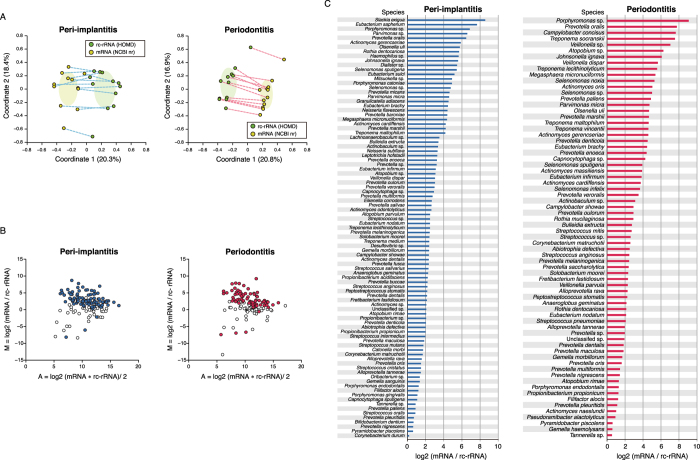
Figure 5. Differences in rc-rRNA and taxonomic mRNA profiles.
(A) PCoA was performed to analyse rc-rRNA and mRNA abundances, and 12 samples in both the peri-implantitis and periodontitis groups are plotted with two coordinates. The mean and standard deviation in each axis are indicated by an ellipse. Dots corresponding to rc-rRNA and mRNA in the same patient are connected by a broken line. (B) VTiFs shown in MA plots for peri-implantitis and periodontitis samples. The y axis shows difference values [M] of rc-rRNA and mRNA abundances and the x axis shows mean values [A]. Coloured points indicate taxa with statistically significant differences in abundance between rc-rRNAs and mRNAs. (C) mRNA/rc-rRNA abundance ratio calculated for each VTiF shown in (B); predominant taxa (based on mean log2 ratios) for the 12 samples are shown in descending order.

