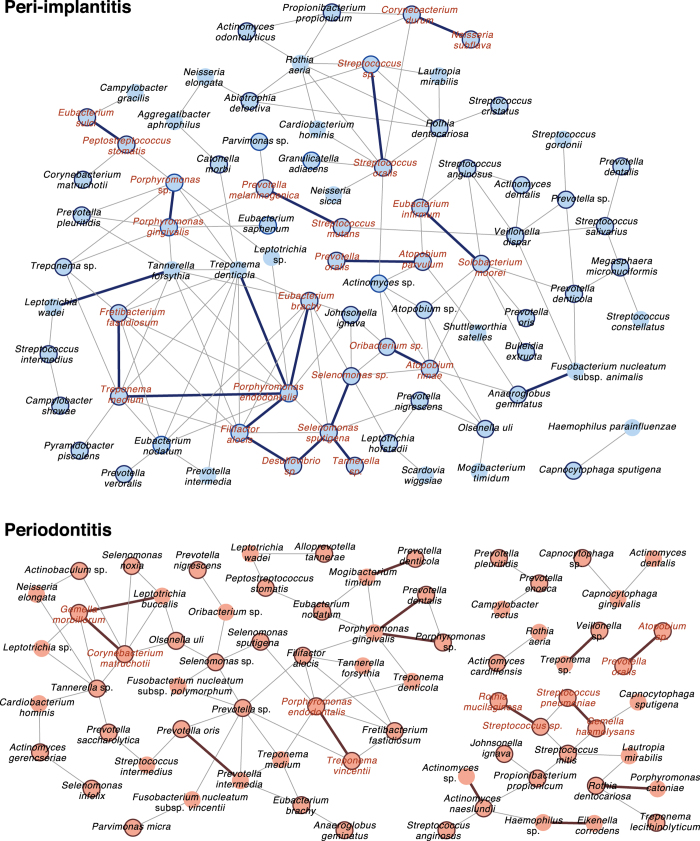
Figure 6. Co-occurrence networks of VTiF profiles.
(A) All networks are shown with each microbial taxon and co-occurrence relationship indicated by a node and edge, respectively. Active taxa are indicated with bold circles, and interactions with significant co-occurrence are indicated with bold lines. Interacting core taxa are indicated in red text for peri-implantitis and periodontitis samples.

