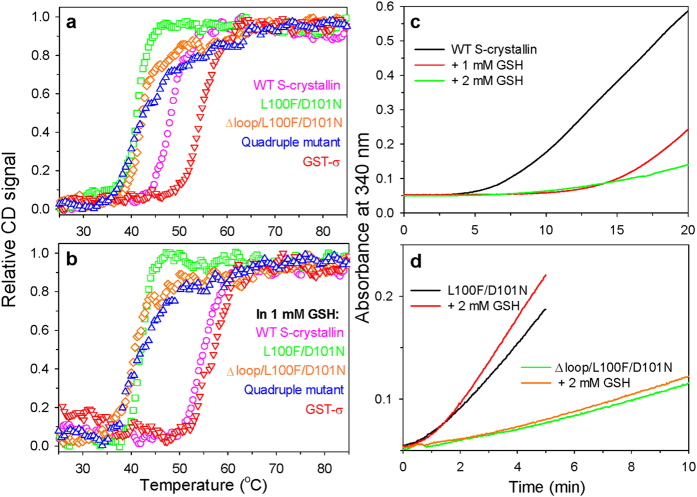
Figure 3.
Protein stability of S-crystallin and its mutants by heat denaturation (a,b) and chemical denaturation (c,d). Plots of the relative CD signal from the ellipticity at 222 nm as a function of the temperature for the wild-type (magenta) and various S-crystallin mutants, the L100F/D101N double mutant (green), the ∆loop/L100F/D101N double mutant (orange), and the L100F/D101N/M104V/Q108F quadruple mutant (blue) without (a) or with (b) 1 mM GSH. The thermal stability of GST-σ (red) without or with 1 mM GSH was also measured. The protein concentration was 7.2 μΜ. The results were fitted in order to calculate their Tm of each mutant. which are shown in Table 2. (c,d) Denaturant-induced light scattering of S-crystallin (c) and its mutants (d). The aggregation traces of S-crystallin in 3.5 M urea without or with GSH at 1–2 mM were observed by light-scattering at 340 nm. The protein concentration was 10 μM. The assays were repeated twice to ensure reproducibility.

