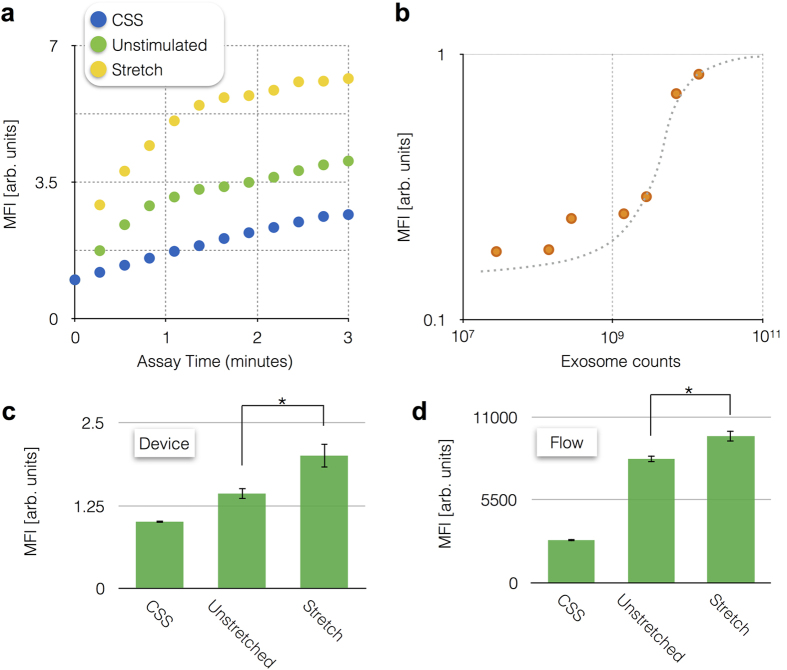
Figure 5. μMED Device operation.
(a) μMED was validated by performing the enzyme amplification assay on-chip and comparing the results to flow cytometry on the assay’s microbeads. (b) We performed a serial dillution of cultured media from our cortical neuron in vitro model to measure the limit of detection. Device response was compared for N = 4 stretched, N = 4 not stretched, and N = 4 negative controls on both the μMED (c) device and on flow (N = 9 stretched, N = 11 not stretched, and N = 7 negative controls) (d), which showed qualitatively similar results. Error bars represent Standard Error of the Mean (SEM). *P < 0.05.

