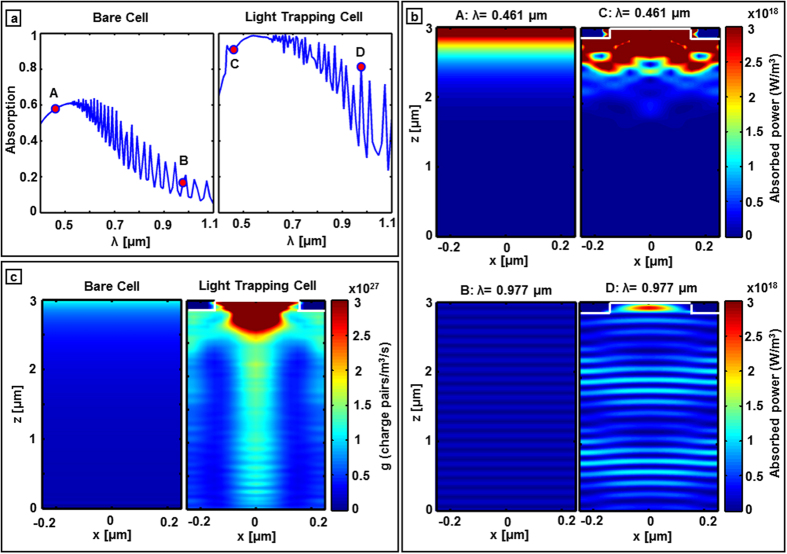
Figure 3. Optical characterization of the device.
(a) Compares the FDTD predicted absolute absorption inside 3 μm thick bare and light trapping cells. (b) The power absorbed per unit volume in 3 μm thick bare and light trapping cell at strong (λ = 461 nm) and weak (λ = 977 nm) absorbing regimes. (c) Compares the wavelength integrated charge carrier generation rate (g) over a 2D plane across the center of the hexagonal unit cell.

