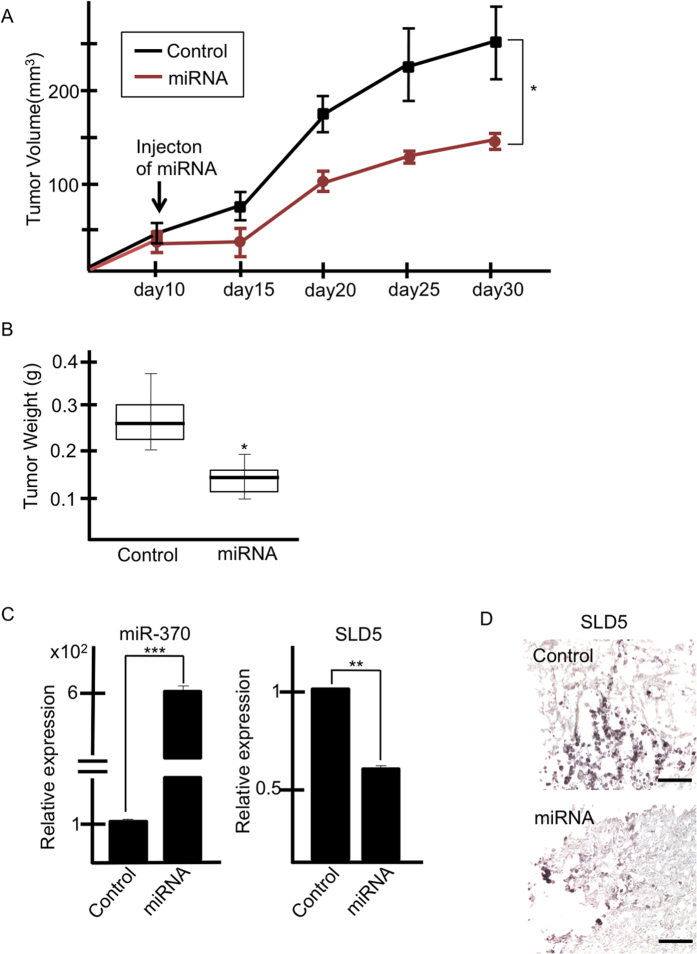
Figure 5. Tumor growth is affected by miR-370.
(A,B) Bladder cancer cells (T24) were subcutaneously transplanted into nude mice. miR-370 mimics or control miR were injected on day10 post-inoculation. (A) Time course of tumor volume dynamics. Data are mean ± SE (n = 3). (B) Tumor weight on day 30 post-inoculation. *p < 0.05 mean ± SE (C) qRT-PCR analysis for assessment of miR-370 or SLD5 mRNA expression in tumors injected with control or miR-370. Data are mean ± SE, **p < 0.0005, ***p < 0.0001 (n = 3). (D) Xenografted tumors injected with control or miR-370 mimics were stained with anti-SLD5 antibody (brown). Sections were counterstained with hematoxylin. Scale bars: 100 μm.

