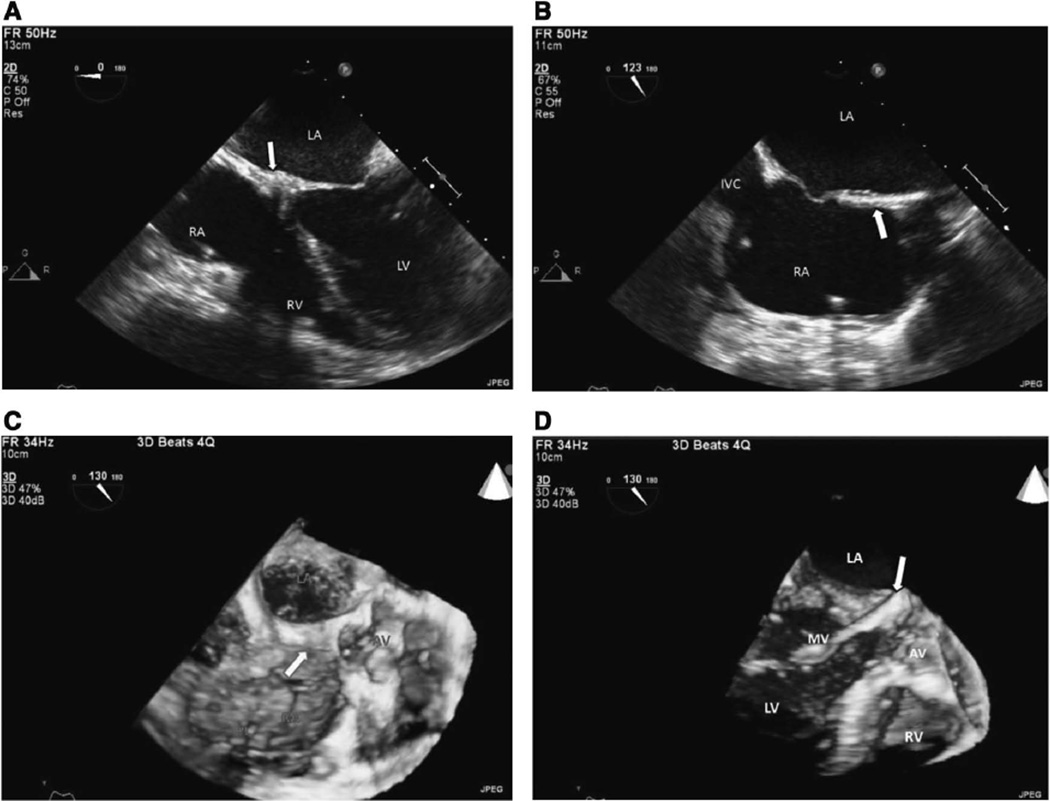
Figure 4.
A, 2D TEE midesophageal 4-chamber view at 0° shows regression of cardiac mass (arrow) at the base of the interatrial septum and A-V node area at end diastole. B, 2D TEE at lower midesophageal view at 123° shows that residual small mass (arrow) has almost completely disappeared at mid and basal interatrial septal area. C, 3D TEE at upper-esophageal short-axis view at 130° shows residual small mass (arrow) involving mid and basal interatrial septum and extending midatrioventricular area. D, 3D TEE at lower-esophageal view at 130° shows that residual small mass (arrow) has almost completely disappeared. Ao indicates aorta; AV, aortic valve; A-V, atrioventricular; IVC, inferior vena cava; LA, left atrium; LV, left ventricle; MV, mitral valve; PL, pacemaker lead; RA, right atrium; RV, right ventricle; 2D, 2-dimensional; 3D, 3-dimensional; and TEE, transesophageal echocardiography.

