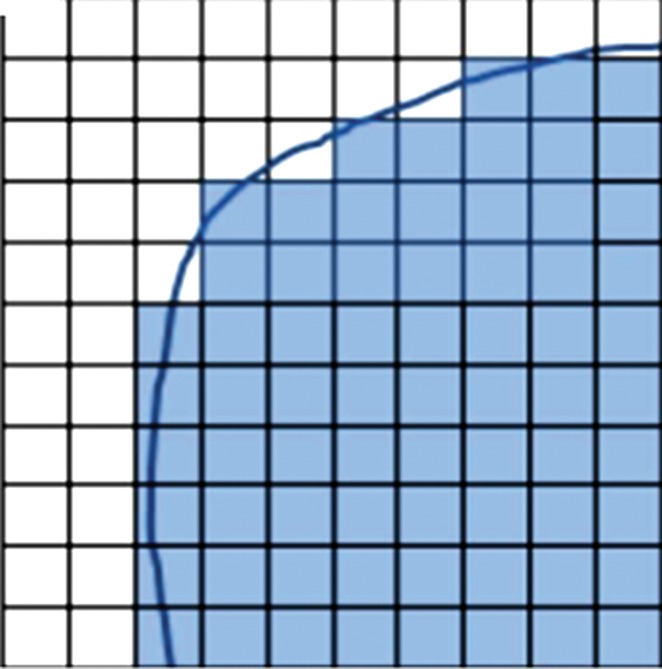
Figure 4a:
Graphs show that quantification of whole or subsegmented pixels results in different area measurements. (a) When the whole pixel is considered, each box represents a single pixel, blue line represents tumor boundary, and only shaded pixels are included for quantification. (b) When pixels are subsegmented to quadrants in this graph, the area included for quantification is different from that in a. Smaller green boxes represent newly included area, and red lines represent pixel quadrants that would be excluded from quantification.

