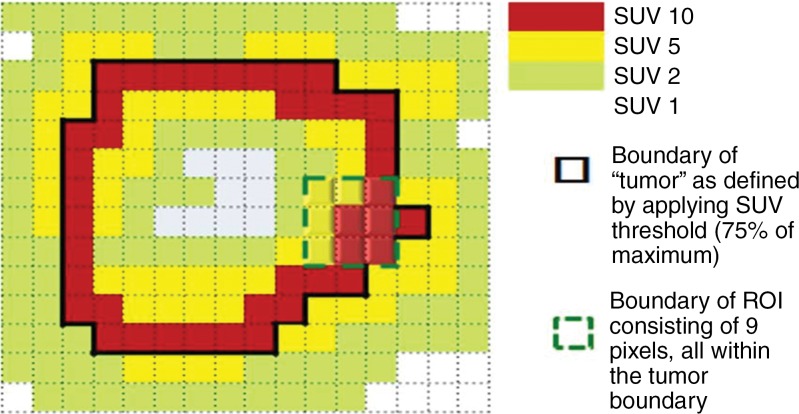
Figure 5a:
Graphs show two-dimensional comparison of two different regions of interest. (a) Region of interest (average standardized uptake value [SUV ], 7.78) is inside tumor boundary (bold black line outside of red squares). (b) Region of interest includes one pixel outside tumor boundary, resulting in higher average value (average SUV, 8.33).

