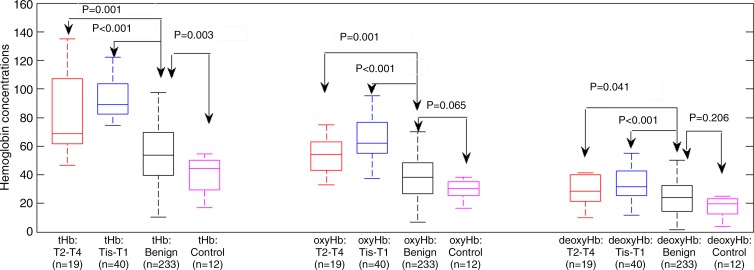
Figure 1:
Box-and-whisker plot of maximum tHb, oxyHb, and deoxyHb of Tis–T1, T2-T2, benign lesions, and control cases. tHb, oxyHb, and deoxyHb levels of Tis–T1 group are significantly higher than in benign lesions and the differences were 35.1 μmol/L (95% confidence interval: 28.1, 42.2 μmol/L), 27.1 μmol/L (95% confidence interval: 20.1, 34.1μmol/L), and 8.5 μmol/L (95% confidence interval: 4.59, 12.50 μmol/L), respectively.

