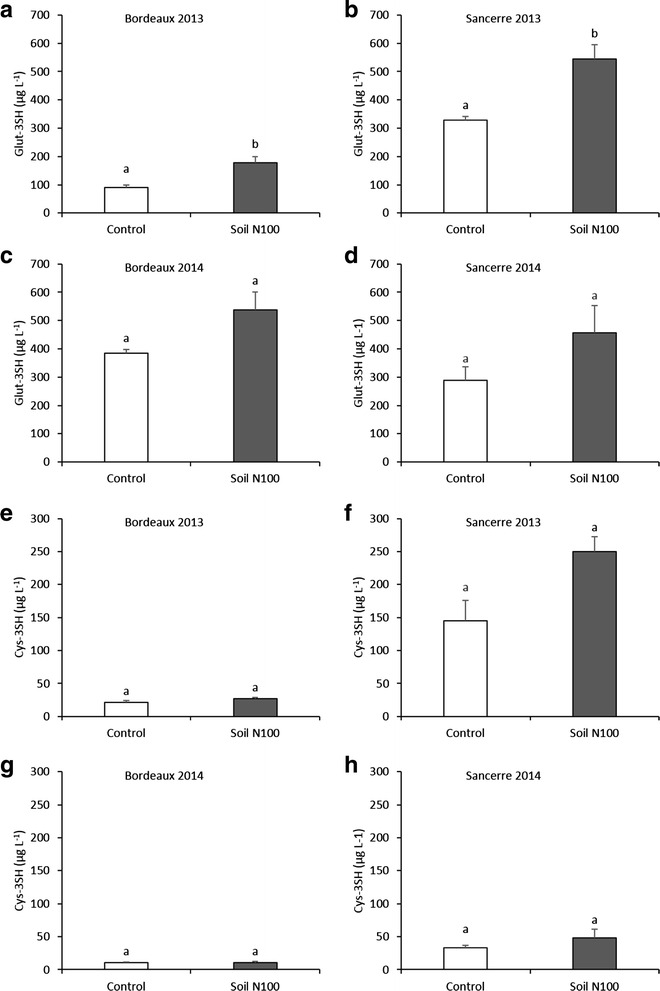
Fig. 7.

Effect of nitrogen supply on the level of Glut-3SH (a - d) and Cys-3SH (e - h) (μg L−1) in grape musts. All data are presented as mean of four biological replicates. Letters indicate significant differences. Error bars indicate Standard Error (SE). Statistical significance was determined by Student’s t test (p value ≤ 0.05)
