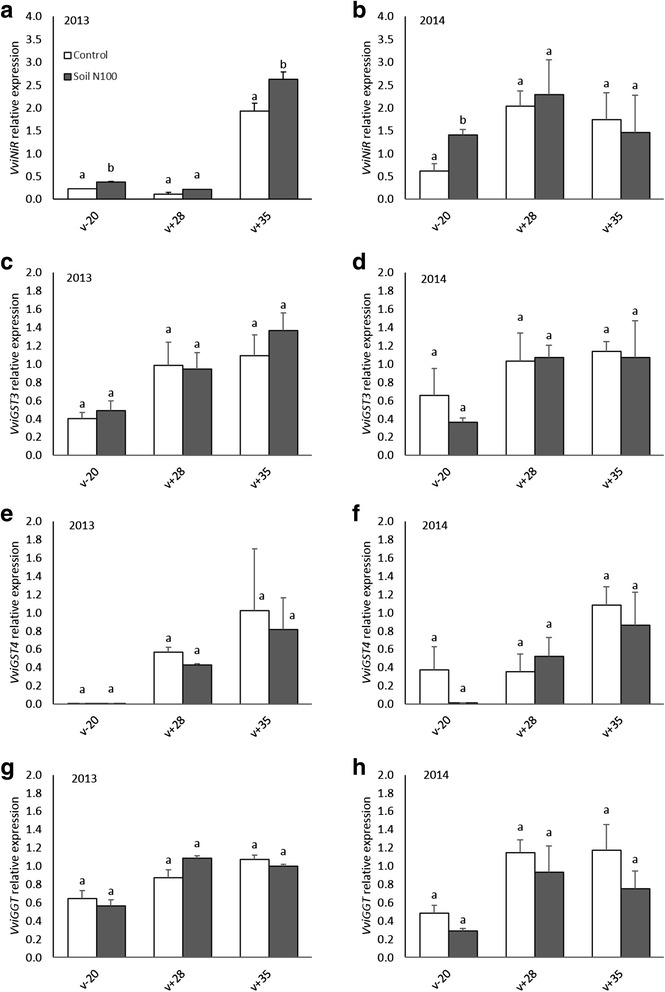
Fig. 8.

Changes in relative transcript levels of genes of VviNiR, VviGST3, VviGST4 and VviGGT in grape berries throughout their development in the Bordeaux experimental site. Transcript levels were analyzed by real-time PCR and are shown relative to expression of VviGAPDH and VviActin in each sample. All data are presented as mean of three biological replicates and two technical replicates. Letters indicate significant differences. Error bars indicate Standard Error (SE). Statistical significance was determined by Student’s t test (p value ≤ 0.05). The white and grey bars represent the control and the soil N100 treatment respectively. (v-20), 20 days before mid-veraison; (v+28), mid-ripening; (v+35), ripeness
