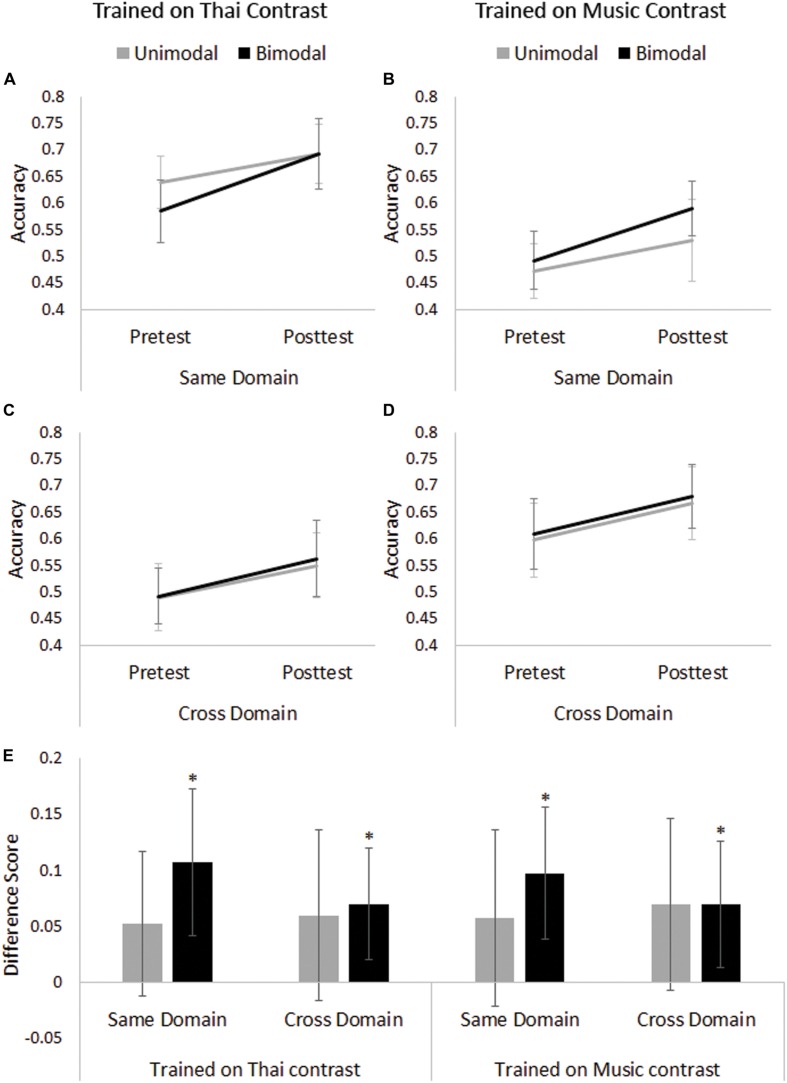
FIGURE 2.
Pretest and Posttest performance by Training Domain and Distribution Condition for (A) same domain test items by Thai group; (B) same domain test items by Music group; (C) cross-domain test items by Thai group; and (D) cross-domain test items by Music group; (E) difference scores (Posttest–Pretest) on the same and cross-domain test items by Training Domain and Distribution Condition. Asterisks indicate significant improvement after Holm–Bonferroni correction. Error bars represent 95% confidence intervals.

