
Fig. 1.
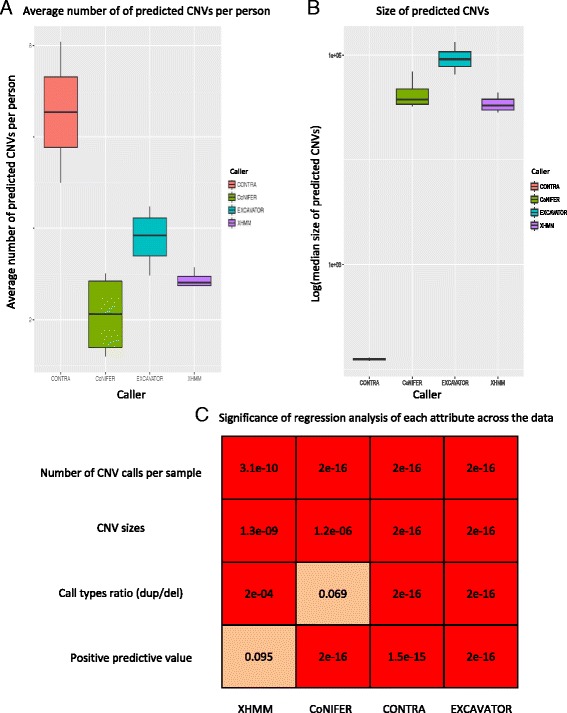
Examining the number of CNVs called, sizes, and correlations. a The boxplot of the number of average number of CNVs per sample across the dataset b The significance of association between the exome study attributes (X-axis) and varying data input. Each row shows association values for the given caller (Y-axis). Reliability = PPV. c Boxplots for predicted CNV median size distribution