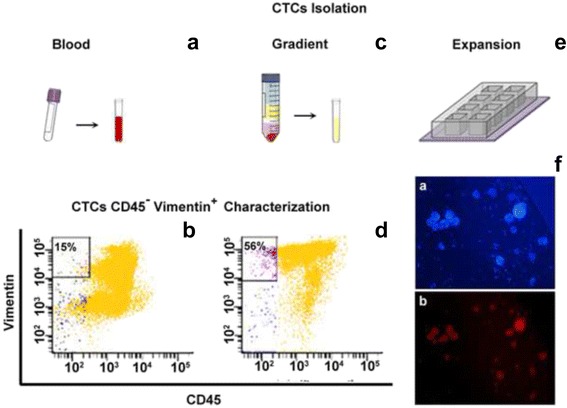
Fig. 1.

CTCs isolation procedure. CTCs isolation was performed on a whole blood sample previously treated with a solution for lysing red blood cells (a), and on a specific phase (after gradient procedure performed centrifuging the peripheral blood mounted on Ficoll) (c). Peripheral blood sample is achieved by searching for cells expressing Vimentin. The reported dot plots in b) (obtained from the analysis of whole blood sample) vs d) (obtained from the analysis after gradient procedure) confirm that the specific phase is enriched for CTCs. Finally, the CTCs were seeded on slide chamber and expanded for 14 days (e). Cultivated CTCs were stained for immunofluorescence analysis (f) highlighting the nuclei in blue, DAPI stained (a), and in red Vimentin expression (b). Scale bar: 200 μm
