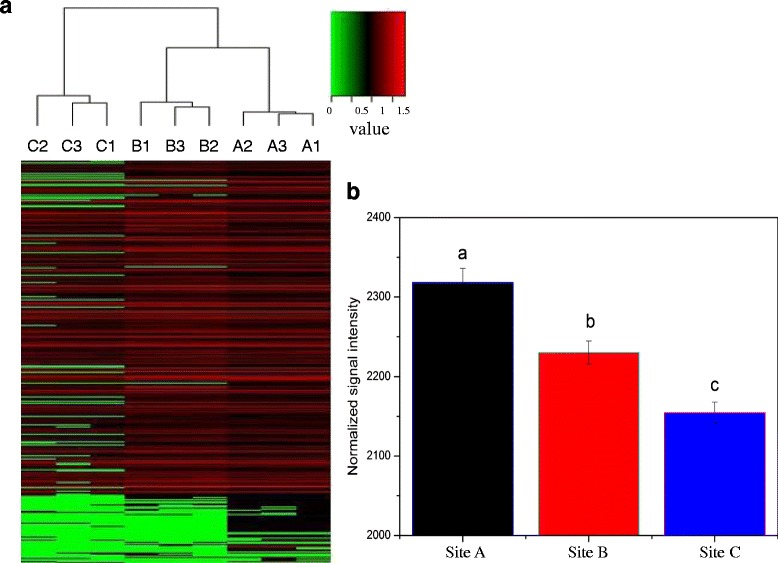
Fig. 6.

a Hierarchical cluster analysis (based on Bray-Curtis distance) of metal resistance genes based on hybridization signal intensities for all wells. Every sample is named after A plant with “1”, “2” or “3” that indicates one of three replicate samples from each plant. b Relative abundance of all detected metal resistance genes. The signal intensity for each functional gene category is the average of the total signal intensity from all replicates. All data are presented as mean ± SE
