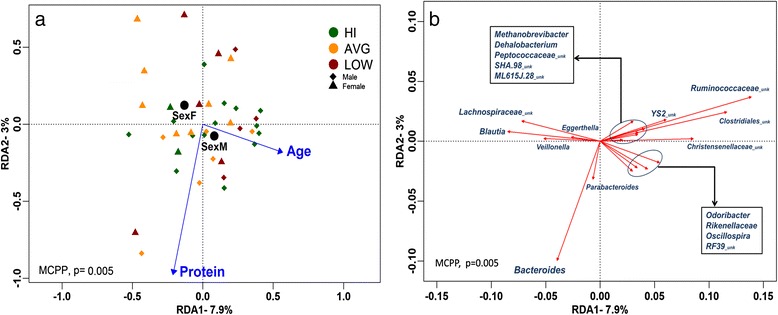
Fig. 4.

Bacterial abundance RDA correlation biplots constrained by selected explanatory variables. The sites and explanatory variables (a) and genera (b) plots are presented separately for clarity; however, they are derived from the same RDA model, note the difference in axes scales. RDA1 and RDA2 which explain over 10 % of total variation in beta diversity are plotted. The global model’s P value was calculated using the Monte Carlo Permutation Procedure (MCPP). In plot A, subjects are color coded according to their CRF levels for illustrative purposes only as groupings were not included in the model. Black circles represent centroids for the categorical variable sex
