
Figure 4.
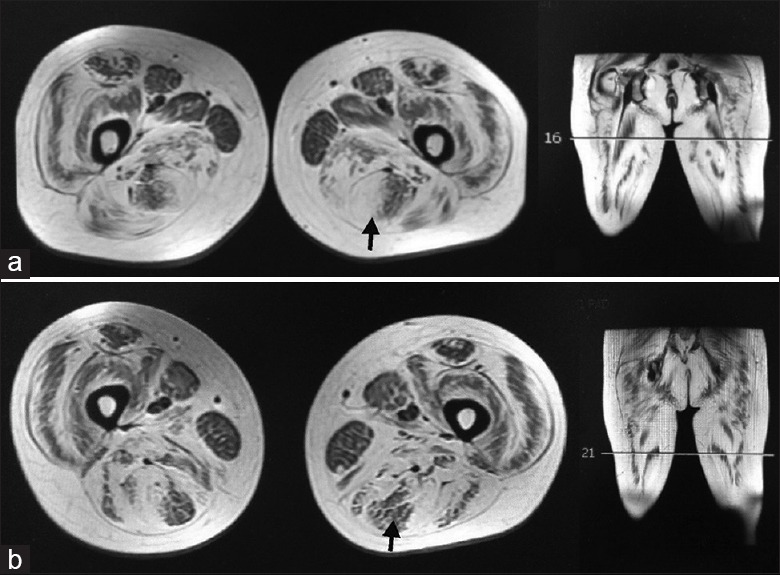
Inhomogeneous fatty infiltration in semitendinosus (shown by arrows). High scores of fatty infiltration appeared in the periphery at upper region (a) and in the central part at lower region (b) of the semitendinosus. The lines on the coronal images represented the different sections of axial images.