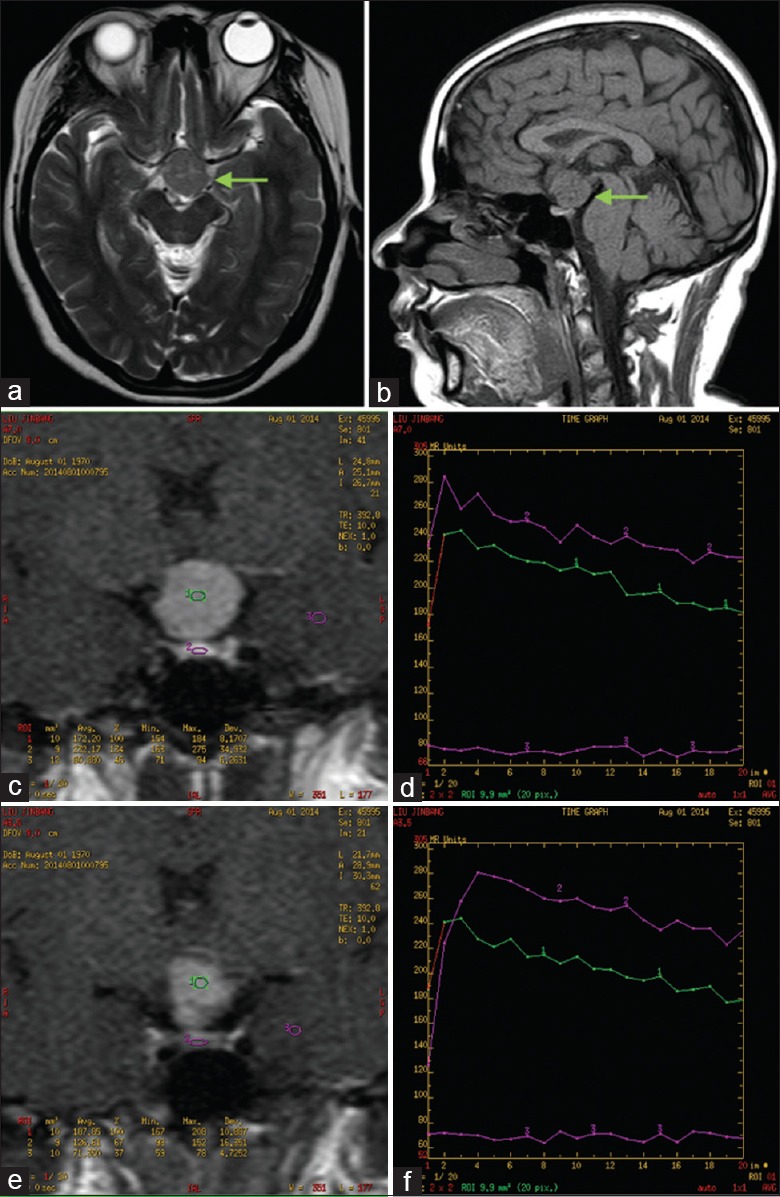
Figure 1.

Plain scan magnetic resonance images (a and b) and SITC of pituicytoma (c-f). Axial T2-WI (a) and sagittal T1-WI (b) show an isointense, oval, well-demarcated mass in the suprasellar cistern (arrows). The “bright spot” of the neurohypophysis is absent. Coronal T1-WI on the slice of neurohypophysis (c) demonstrates three ROIs: 1 is tumor, 2 is neurohypophysis, and 3 is temporal lobe. (d) SITCs of three ROIs in (c): the SITC of the tumor is rapid and initial strong enhancement and it is similar to that of neurohypophysis. Coronal T1-WI on the slice of adenohypophysis (e) demonstrates three ROIs: 1 is the tumor, 2 is adenohypophysis, and 3 is temporal lobe. (f) SITCs of three ROIs in (c): Time to peak of the tumor is earlier than that of adenohypophysis. ROIs: Regions of interest; SITC: Signal intensity-time curve; T1-WI: T1-weighted image; T2-WI: T2-weighted image.
