
Table 1.
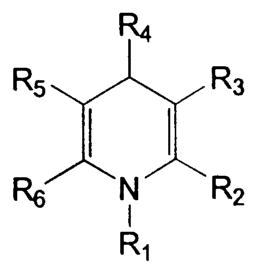
Inhibition of capacitative calcium influx through SOC channels in HL-60 cells by 1,4-dihydropyridines
| ||||||||
|---|---|---|---|---|---|---|---|---|
| Compound | R1 | R2 | R3 | R4 | R5 | R6 | IC50a (μM) | Imaxb (%) |
| 1 | H | Me | COOEt | Ph | COOMe | Me | 40 ± 8 | 75 ± 6 |
| 2 | H | Me | COOEt | CH=CH–Ph | COOMe | Me | 15 ± 6 | 50 ± 6 |
| 3 | H | Me | COOEt | C≡C–Ph | COOMe | Me | NIc | NI |
| 4 | H | Me | COOEt | 2-Thienyl | COOEt | Me | NI | NI |
| 5 | H | Me | COOEt | 4-NO2–Ph | COOEt | Me | 6.5 ± 2.8 | 70 ± 10 |
| 6d | H | Me | COOEt | 3-NO2–Ph | COOMe | Me | 3.3 ± 1.2 | 80 ± 6 |
| 7 | H | Me | COOEt | 3-NO2–Ph | COOEt | Me | 5.0 ± 2.1 | 90 ± 3 |
| 8e | H | Me | COOMe | 2-NO2–Ph | COOMe | Me | 16 ± 2 | 75 ± 3 |
| 9 | H | Me | COOEt | 3,5-(NO2)2–Ph | COOEt | Me | 7 | 95 |
| 10 | H | Me | COOEt | 3-NH2–Ph | COOEt | Me | NI | NI |
| 11 | H | Me | COOEt | 3-CF3–Ph | COOEt | Me | 2.6 ± 0.6 | 55 ± 2 |
| 12 | H | Me | COOEt | 3-(NHCOMe)–Ph | COOEt | Me | NI | NI |
| 13 | H | Me | COOEt | 4-OMe–Ph | COOMe | Me | 36 ± 3 | 75 ± 5 |
| 14 | H | Me | COOEt | 2-CF3–Ph | COOMe | Me | 35 ± 4 | 75 ± 4 |
| 15 | H | Me | COOEt | 3-OMe-4-OH–Ph | COOMe | Me | 25 | 75 |
| 16 | H | Me | COOEt | 3-NO2–Ph | COSEt | Me | 8 | 70 |
| 17 | H | Me | COOEt | 3-NO2–Ph | CN | Me | NI | NI |
| 18 | H | Me | COOEt | 3-NO2–Ph | COO(CH2)2OH | Me | 30 | 80 |
| 19 | H | Me | COOEt | 3-NO2–Ph | COO(CH2)2OMe | Me | >100 | NDf |
| 20 | H | Me | COOEt | 3-NO2–Ph | COOCH2Ph | Me | 1.8 ± 0.1 | 95 ± 5 |
| 21 | H | Me | COOCH2Ph | 3-NO2–Ph | COOCH2Ph | Me | 3.0 ± 1.5 | 97 ± 2 |
| 22 | H | Me | COOEt | 3-NO2–Ph | COOCH2-(4-NO2)–Ph | Me | NI | NI |
| 23 | H | Me | COOMe | 3-NO2–Ph | COOMe | Me | 8.0 ± 4.0 | 50 ± 5 |
| 24 | H | Et | COOEt | 3-NO2–Ph | COOEt | Et | 10 | 55 |
| 25 | H | Me | COOEt | 3-NO2–Ph | COSEt | Et | 15 | 75 |
| 26 | H | Me | COOEt | 3-NO2–Ph | COOEt | CF3 | NI | NI |
| 27 | H | Me | COOEt | 3-NO2–Ph | COOCH2Ph | Cyclopropyl | NI | NI |
| 28 | H | Me | COOEt | 3-NO2–Ph | COOCH2Ph | Cyclobutyl | NI | NI |
| 29 | H | Me | COOEt | Me | COOEt | Ph | NI | NI |
| 30 | Me | Me | COOMe | 3-NO2–Ph | COOMe | Me | 2.8 ± 0.3 | 88 ± 4 |
| 31 | Me | Me | COOEt | 3-NO2–Ph | COOEt | Me | 2.0 ± 0.8 | 72 ± 11 |
| 32 | Me | Me | COOEt | 3-NO2–Ph | COOMe | Me | 2.6 ± 1.1 | 84 ± 12 |
| 33 | Et | Me | COOEt | 3-NO2–Ph | COOMe | Me | 6 | 75 |
| 34 | Allyl | Me | COOEt | 3-NO2–Ph | COOMe | Me | 6.8 ± 1.8 | 69 ± 7 |
| 35 | Propargyl | Me | COOEt | 3-NO2–Ph | COOMe | Me | 1.7 ± 1.3 | 78 ± 12 |
| 36 | Benzyl | Me | COOEt | 3-NO2–Ph | COOMe | Me | 28 | 51 |
a
The IC50 values represent the mean concentration ± SEM (N = 3–6) required for 50% of the maximum inhibition observed for each compound, as shown in Fig. 3A–C. Single values are the average of two determinations.
b
Imax represents the maximum inhibition ± SEM by the DHP of the sustained calcium levels elicited by 10 μM ATP.
c
NI: no inhibition observed at concentrations up to 100 μM.
d
Nitrendipine.
e
Nifedipine.
f
ND=not determined.